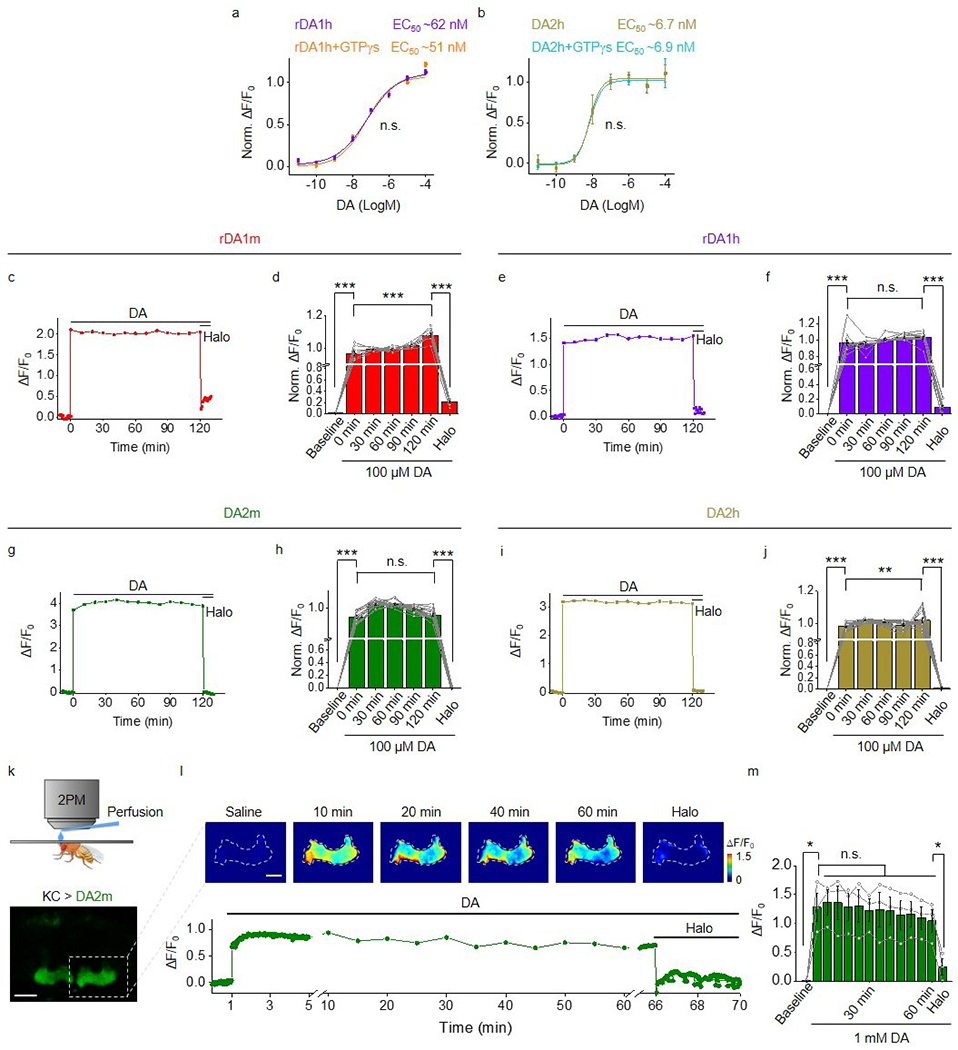
Extended Data Fig. 5. The minimal coupling of GRABDA sensors to downstream Gi pathway and β-arrestin pathway.

a,b, Normalized ΔF/F0 in sensor-expressing cells in response to DA, with or without the pre-bathing of GTPγS. n=3 wells with 500–3000 cells/well.
c,d, The representative trace of ΔF/F0 (c) and the group summary of normalized ΔF/F0 (d) in rDA1m-expressing neurons during a 2-hour treatment of 100 μM DA. n=9 neurons. For the group summary, the averaged ΔF/F0 of each neuron during the 2-hour DA treatment is normalized to 1. Two-tailed Student’s t-test was performed. p=2.10×10⁻²¹ (***) between baseline and 0 min; p=2.99×10⁻¹⁷ (***) between 120 min and Halo; p=1.24×10⁻⁵ (***) between 0 min and 120 min.
e,f, Similar to c and d except that rDA1h was expressed in cultured neurons. n=11 neurons. Two-tailed Student’s t-test was performed. p=1.87×10⁻⁶ (***) between baseline and 0 min; p=3.43×10⁻¹⁷ (***) between 120 min and Halo; p=0.1519 (n.s.) between 0 min and 120 min.
g,h, Similar to c and d except that DA2m was expressed in cultured neurons. n=15 neurons. Two-tailed Student’s t-test was performed. p=2.48×10−39 (***) between baseline and 0 min; p=7.42×10⁻³⁵ (***) between 120 min and Halo; p=0.3322 (n.s.) between 0 min and 120 min.
i,j, Similar to c and d except that DA2h was expressed in cultured neurons. n=17 neurons. Two-tailed Student’s t-test was performed. p=1.14×10−52 (***) between baseline and 0 min; p=9.80×10−38 (***) between 120 min and Halo; p=0.0061 (**) between 0 min and 120 min.
k, Top, schematic illustration depicting the in vivo perfusion experiment. Bottom, the fluorescence image of a transgenic fly expressing DA2m in MB KCs. Scale bar, 50 μm.
l,m, Representative images (l, top), trace (l, bottom) and group summary (m) of ΔF/F0 in response to the 1-hour perfusion of 1 mM DA followed by 100 μM Halo in a transgenic fly expressing DA2m in MB KCs. n=3 flies. Scale bar, 25 μm. Two-tailed Student’s t-test was performed. p=0.0382 (*) between baseline and 10 min; p=0.0293 (*) between 60 min and Halo; p=0.5289 (n.s.), 0.5593 (n.s.), 0.9559 (n.s.), 0.8537 (n.s.), 0.6346 (n.s.), 0.6530 (n.s.), 0.2760 (n.s.), 0.1649 (n.s.), 0.1547 (n.s.), 0.1152 (n.s.), 0.1044 (n.s.) between 5 min and 10 min, 15 min, 20 min, 25 min, 30 min, 35 min, 40 min, 45 min, 50 min, 55 min, 60 min, respectively.
Data are presented as the mean ± s.e.m.. in a, b, d, f, h, j, m.
