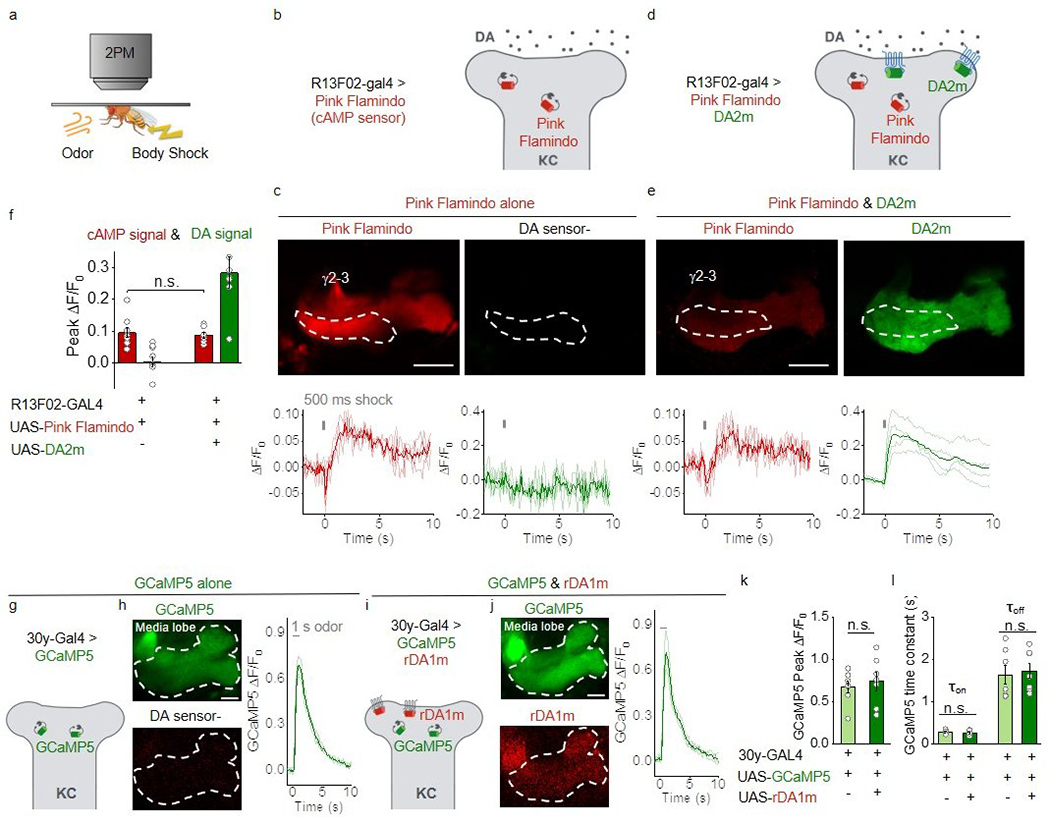
Extended Data Fig. 7. Expressing GRABDA2m or GRABrDA1m sensors shows no significant effect on cAMP or calcium signaling respectively in vivo.

a, Schematic illustration depicting the experimental setup.
b-e, Schematic illustrations depicting the experimental strategy (b,d), representative fluorescence images and ΔF/F0 traces (c,e) in flies expressing the cAMP sensor Pink-Flamindo (b,c) or co-expressing Pink-Flamindo and DA2m (d,e) in MB KCs. The ROIs for measuring the γ2-γ3 compartments in the MB are indicated by dashed white lines. Scale bars, 25 μm.
f, Group summary of peak ΔF/F0. n=9, 7 flies for Pink Flamindo alone, Pink Flamindo & DA2m. Two-tailed Student’s t-test was performed. p= 0.7332 (n.s.).
g-j, Schematic illustrations depicting the experimental strategy (g,i), representative fluorescence images and ΔF/F0 traces (h,j) in flies expressing the calcium sensor GCaMP5 (g,h) or co-expressing GCaMP5 and rDA1m (i,j) in MB KCs. The ROIs for measuring the MB media lobe are indicated by dashed white lines. Similar results were observed for 7 flies. Scale bars, 25 μm.
k,l, Group summary of GCaMP5 peak ΔF/F0 and time constants. n=7 flies each. Two-tailed Student’s t-test was performed. k, p=0.607 (n.s.). l, p=0.601 (n.s.), 0.735 (n.s.) for τon, τoff.
Average traces (bold) overlaid with single-trial traces (light) from one fly are shown for representation in c, e, h, j. Data are presented as the mean ± s.e.m. in f, k, l.
