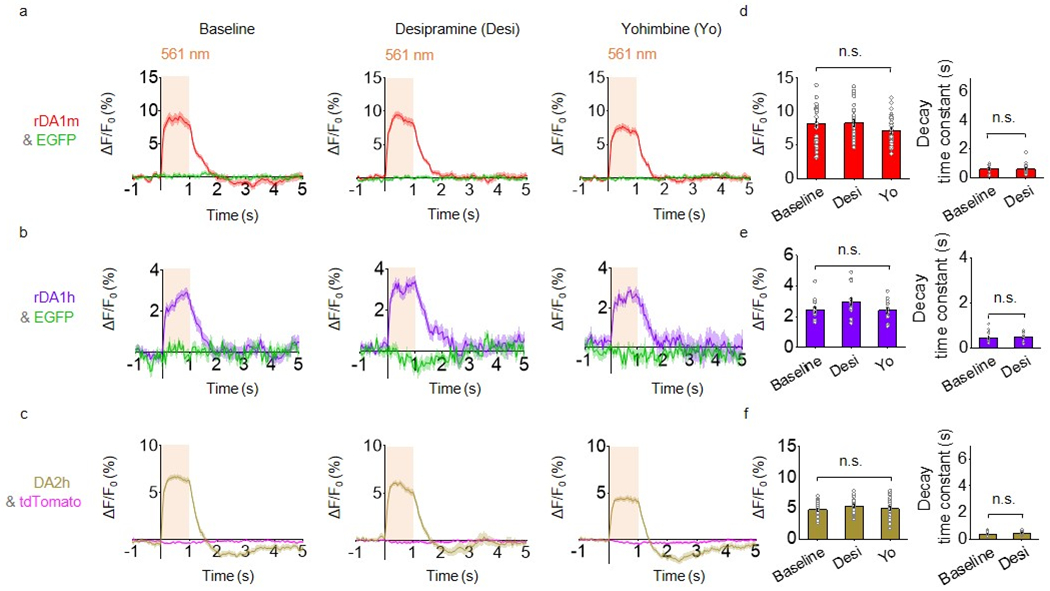
Extended Data Fig. 8. Optogenetically induced nigrostriatal DA release in freely moving mice is not affected by desipramine or yohimbine.

a-c, Average traces of ΔF/F0 in mice expressing rDA1m and EGFP (a), rDA1h and EGFP (b), or DA2h and tdTomato (c) in the dorsal striatum. Where indicated, the experiments were conducted in mice treated with either the norepinephrine transporter blocker desipramine or the α2AR antagonist yohimbine.
d-f, Group summary of ΔF/F0 and τoff for the experiments shown in a-c, respectively. n=30 trials from 6 hemispheres of 6 mice for rDA1m. n=15 trials from 3 hemispheres of 3 mice for rDA1h, n=25 trials from 5 hemispheres of 4 mice for DA2h. Two-tailed Student’s t-test was performed. d, left, p=0.1614 (n.s.); right, p=0.9836 (n.s.). e, left, p=0.9018 (n.s.); right, p=0.6605 (n.s.). f, left, p=0.6489 (n.s.); right, p=0.2322 (n.s.).
Average traces shaded with ± s.e.m. are shown in a-c. Data are presented as the mean ± s.e.m. in d-f.
