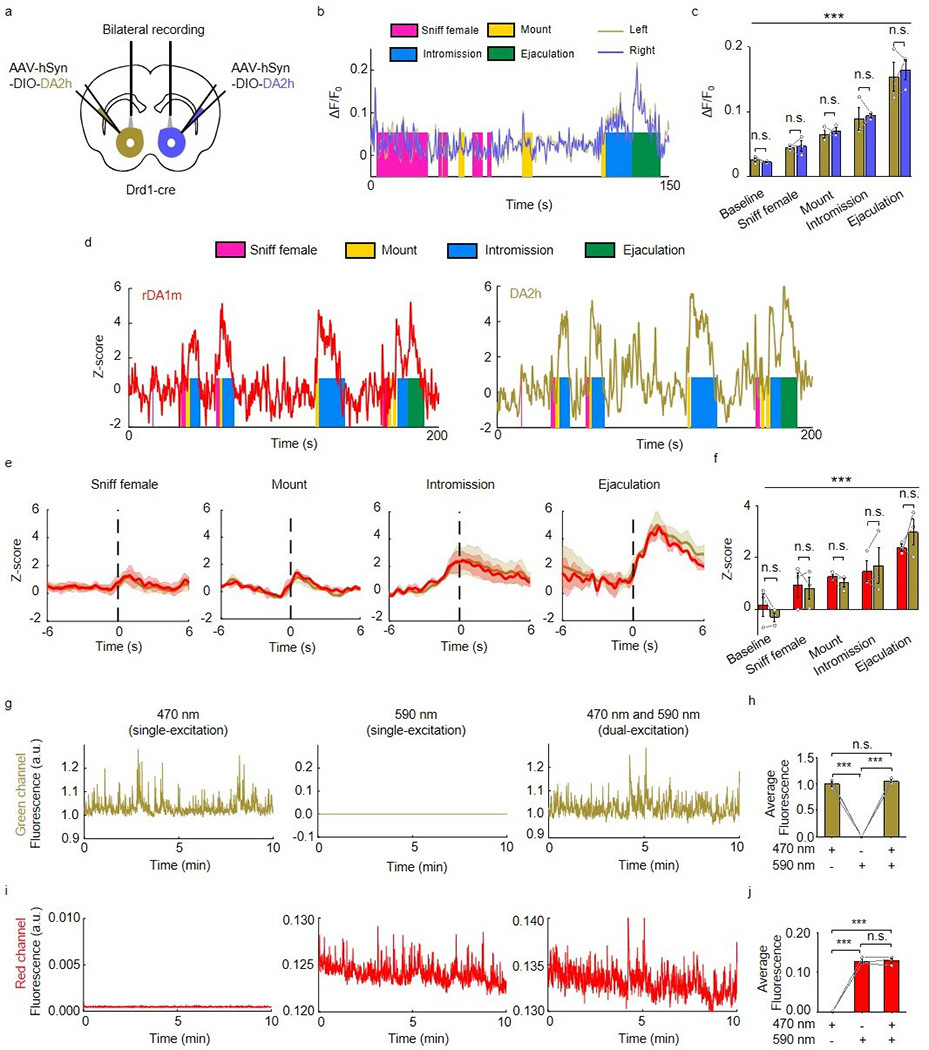
Extended Data Fig. 10. The DA signal in the mouse NAc during sexual behavior.

a, Schematic illustration depicting the experimental strategy.
b,c, Representative traces (b) and group summary (c) of ΔF/F0 measured from left and right hemispheres during the indicated stages of mating. n=3 mice. F4,16=80.92, p<10−6 (***) for row factor and F1,4=0.1224, p=0.7441 (n.s.) for column factor by two-way ANOVA. Bonferroni’s multiple comparisons test was performed between groups, p>0.9999 (n.s.), p>0.9999 (n.s.), p>0.9999 (n.s.), p>0.9999 (n.s.), p>0.9999 (n.s.).
d, Representative traces of the concurrent Z-score signals of rDA1m and DA2h during the indicated stages of sexual behavior. Similar results were observed for 3 mice.
e, Average post-stimulus histograms showing the Z-score signals of rDA1m and DA2h aligned to the onset of the indicated mating events. n=3 mice. Average traces shaded with ± s.e.m. are shown.
f, Group summary of the Z-scores measured for rDA1m and DA2h during the indicated mating events. n=3 mice. F4,16=13.02, p=6.6×10⁻⁵ (***) for row factor and F1,4=0.001, p=0.9797 (n.s.) for column factor by two-way ANOVA. Bonferroni’s multiple comparisons test was performed, p>0.99 (n.s.), p>0.99 (n.s.), p>0.99 (n.s.), p>0.99 (n.s.), p>0.99 (n.s.).
g, h, The representative fluorescence signal (g) and group analysis (h) in the green channel when the excitation light is delivered at 470 nm alone (g, left), at 590 nm alone (g, center) or at 470 nm and 590 nm simultaneously (g, right). n=3 mice. F2,4=531.6, p=3.1×10⁻⁵ (***) by one-way ANOVA. Tukey’s multiple comparisons test was performed between groups, p=3.1×10⁻⁵ (***), p=2.6×10⁻⁵ (***), p=0.4904 (n.s.).
i, j, Similar to g and h except the fluorescence signal in the red channel is analyzed. n=3 mice. F2,4=414.2, p=2.3×10⁻⁵ (***) by one-way ANOVA. Tukey’s multiple comparisons test was performed between groups, p=4.8×10⁻⁵ (***), p=4.6×10⁻⁵ (***), p=0.9738 (n.s.).
Data are presented as the mean ± s.e.m. in c, f, h, j.
