
Fig. 2 |. Characterization of GRABDA sensors in HEK293T cells and cultured rat cortical neurons.
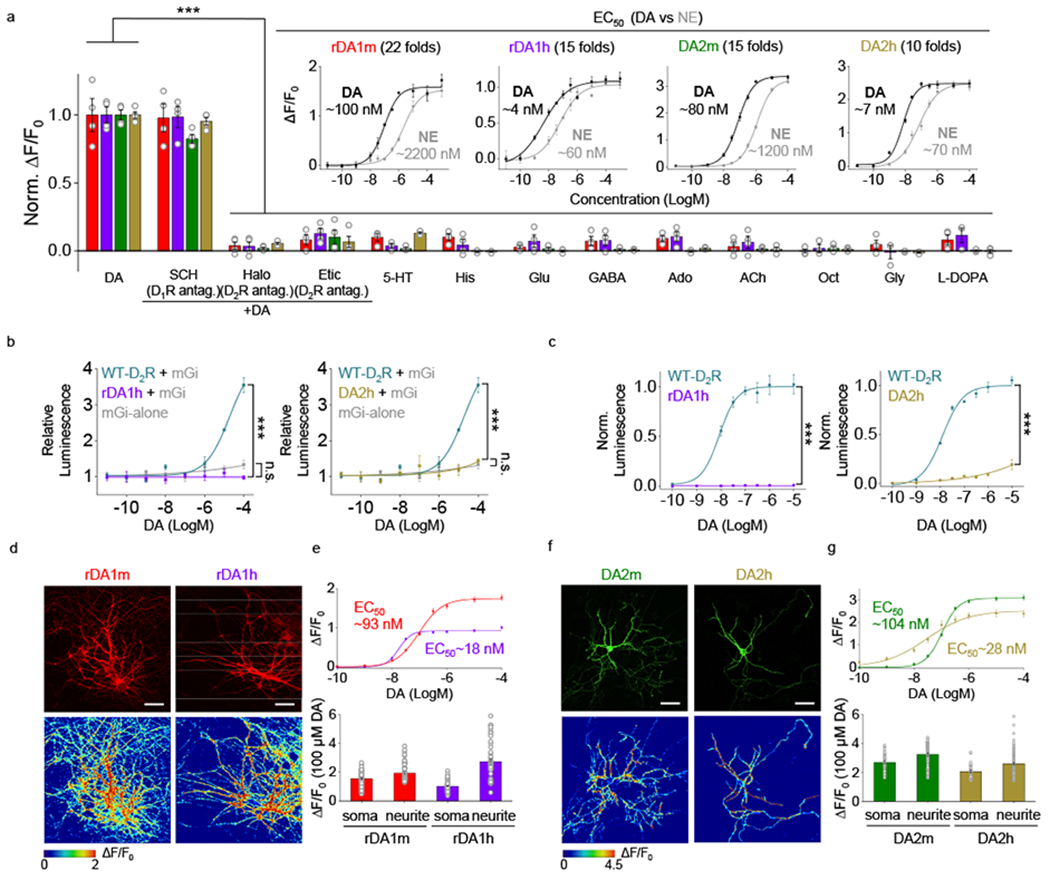
a, Normalized ΔF/F0 in sensor-expressing HEK293T cells following the application of DA alone, DA+SCH-23390 (SCH), DA+haloperidol (Halo), DA+eticlopride (Etic), serotonin (5-HT), histamine (His), glutamate (Glu), gamma-aminobutyric acid (GABA), adenosine (Ado), acetylcholine (ACh), octopamine (Oct), glycine (Gly), or L-DOPA (all applied at 1 μM). n=3 wells for rDA1h in response to 5-HT, Oct, Gly and L-DOPA. n=4 wells for the others. Each well contains 200-1200 cells. The insets show dose-response curves for DA and norepinephrine (NE); n=3 wells with 200–800 cells/well each. Two-tailed Student’s t-test was performed. rDA1m, p=0.8816 (n.s.), 0.0001 (***), 0.0002 (***), 0.0002 (***), 0.0002 (***), 8.94×10⁻⁵ (***), 0.0001 (***), 0.0001 (***), 0.0001 (***), 7.65×10⁻⁵ (***), 0.0001 (***), 0.0002 (***) between DA and DA+SCH, DA+Halo, DA+Etic, 5-HT, His, Glu, GABA, Ado, ACh, Oct, Gly, L-DOPA, respectively. rDA1h, p=0.8648 (n.s.), 4.12×10⁻⁶ (***), 7.94×10⁻⁶ (***), 2.34×10⁻⁵ (***), 5.13×10⁻⁶ (***), 7.89×10⁻⁶ (***), 5.77×10⁻⁶ (***), 6.37×10⁻⁶ (***), 7.45×10⁻⁶ (***), 2.63×10⁻⁵ (***), 3.86×10⁻⁵ (***), 8.60×10⁻⁵ (***) between DA and DA+SCH, DA+Halo, DA+Etic, 5-HT, His, Glu, GABA, Ado, ACh, Oct, Gly, L-DOPA, respectively. DA2m, p=0.0105 (*), 1.99×10⁻⁷ (***), 7.18×10⁻⁶ (***), 1.92×10⁻⁷ (***), 1.54×10⁻⁷ (***), 2.00×10⁻⁷ (***), 1.77×10⁻⁷ (***), 1.55×10⁻⁷ (***), 1.80×10⁻⁷ (***), 2.46×10⁻⁷ (***), 1.50×10⁻⁷ (***), 1.62×10⁻⁷ (***) between DA and DA+SCH, DA+Halo, DA+Etic, 5-HT, His, Glu, GABA, Ado, ACh, Oct, Gly, L-DOPA, respectively. DA2h, p=0.2613 (n.s.), 2.90×10⁻⁸ (***), 1.15×10⁻⁶ (***), 4.20×10⁻⁸ (***), 1.50×10⁻⁸ (***), 1.83×10⁻⁸ (***), 1.61×10⁻⁸ (***), 1.80×10⁻⁸ (***), 3.51×10⁻⁸ (***), 1.87×10⁻⁸ (***), 1.46×10⁻⁸ (***), 2.83×10⁻⁸ (***) between DA and DA+SCH, DA+Halo, DA+Etic, 5-HT, His, Glu, GABA, Ado, ACh, Oct, Gly, L-DOPA, respectively.
b, Luciferase complementation assay for assessing Gi coupling. n=3 wells each. The luminescence signals are normalized against the luminescence signals measured in the control buffer-treated cells. Cells expressing mGi alone serve as the control. Two-tailed Student’s t-test was performed. p=9.87×10⁻⁵ (***) between rDA1h and WT-D2R; p=0.1124 (n.s.) between rDA1h and mGi-alone; p=0.0001 (***) between DA2h and WT-D2R; p=0.2836 (n.s.) between DA2h and mGi-alone.
c, TANGO assay for measuring β-arrestin coupling. n=3 wells each. The maximum luminescence signals of WT-D2R are normalized to 1. Two-tailed Student’s t-test was performed. p=0.0004 (***) between rDA1h and WT-D2R; p=0.0001 (***) between DA2h and WT-D2R.
d, Representative images of sensor expression (top) and response to 100 μM DA (bottom) in neurons expressing the indicated sensors. Similar results were observed for more than 30 neurons. Scale bars, 10 μm.
e, Dose-response curves (top) and group summary (bottom) of the responses measured in the soma and neurites of sensor-expressing neurons. Top, n=34, 14 neurons for rDA1m, rDA1h. Bottom, n=59, 68 ROIs from 59 neurons for rDA1m (soma), rDA1m (neurite); n=58, 58 ROIs from 58 neurons for rDA1h (soma), rDA1h (neurite).
f, Representative images of sensor expression (top) and response to 100 μM DA (bottom) in neurons expressing the indicated sensors. Similar results were observed for more than 20 neurons. Scale bars, 10 μm.
g, Dose-response curves (top) and group summary (bottom) of the responses measured in the soma and neurites of sensor-expressing neurons. Top, n=32, 21 neurons for DA2m and DA2h. Bottom, n=54, 85 ROIs from 54 neurons for DA2m (soma), DA2m (neurite); n=30, 145 ROIs from 30 neurons for DA2h (soma), DA2h (neurite).
Data are presented as the mean ± s.e.m. in a, b, c, e, g.