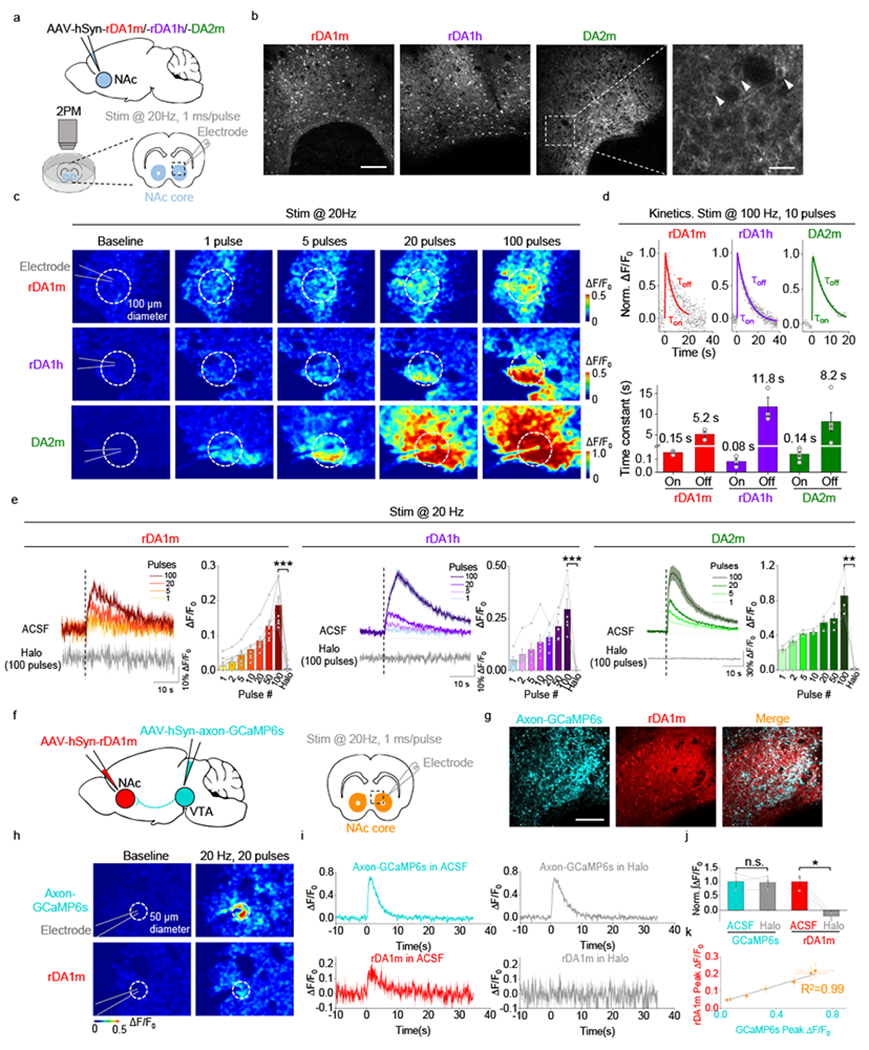
Fig. 3 |. GRABDA sensors can be used to measure DA release in acute mouse brain slices.

a, Schematic illustration depicting the experimental design for panels b-e.
b, Representative fluorescence images showing the expression of sensors in the NAc. The arrowheads indicate the somas of individual neurons. Similar results were observed for 3-4 mice. Scale bar, 100 μm (left) and 20 µm (right).
c, Responses to electrical stimulation measured in sensor-expressing brain slices. The dashed circles indicate the ROIs used to analyze the signals.
d, Representative traces showing the normalized ΔF/F0 (top) and group summary of τon and τoff (bottom) in response to 10 electrical stimuli applied at 100 Hz. The data were processed with 2×binning. Each trace was fitted with a single-exponential function to determine τon and τoff. n=3 slices from 2 mice for rDA1m, n=3 slices from 2 mice for rDA1h, n=5 slices from 3 mice for DA2m.
e, Representative traces and group summary of the ΔF/F0 in response to electrical stimulation. n=7 slices from 4 mice for rDA1m, n=6 slices from 4 mice for rDA1h, n=3 slices from 2 mice for DA2m. Two-tailed Student’s t-test was performed. p=2.97×10⁻⁵ (***), 0.0002 (***), 0.0061 (**) for rDA1m, rDA1h, DA2m.
f, Schematic illustration depicting the experimental design for panels g-j.
g, Representative fluorescence images showing the expression of GCaMP6s and rDA1m in the NAc. Similar results were observed for 3 mice. Scale bar, 100 μm.
h, Response images of axon-GCaMP6s and rDA1m following electrical stimulation. The dashed circles indicate the ROIs used to analyze the signals.
i-j, Representative traces (i) and group summary (j) of the ΔF/F0 in response to electrical stimulation. n=3 slices from 3 mice. Two-tailed Student’s t-test was performed. p=0.8361 (n.s.), 0.0244 (*) for GCaMP6s, rDA1m.
k, The peak ΔF/F0 of rDA1m plotted against the peak ΔF/F0 of axon-GCaMP6s in response to various numbers of pulses applied at 20 Hz. The data were fitted to a linear function. n=8 slices from 3 mice.
Average traces shaded with ± s.e.m. from one slice are shown for representation in e, i.
Data are presented as the mean ± s.e.m. in d (bottom), e, j, k.
