
Fig. 5 |. GRABDA sensors can detect optogenetically induced nigrostriatal DA release in freely moving mice.
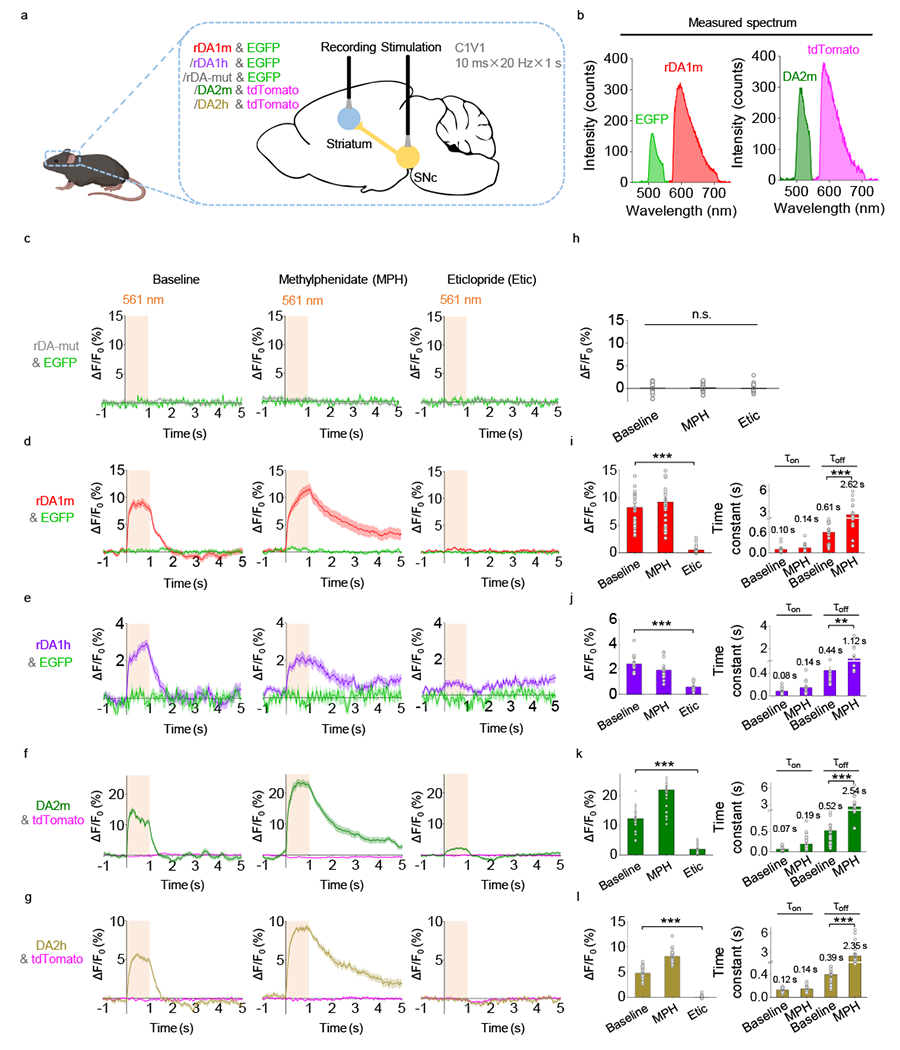
a, Schematic illustration depicting the experimental setup.
b, Measured emission spectra in vivo using fiber photometry.
c-g, Average ΔF/F0 traces of the indicated sensors and fluorescent proteins during optogenetic stimulation under control conditions (left) or in the presence of methylphenidate (MPH) or eticlopride (Etic).
h-l, Group summary of ΔF/F0 and time constants (where applicable) for the corresponding sensors in panels c-g, respectively. n=30 trials from 6 hemispheres of 3 mice for rDA-mut. n=30 trials from 6 hemispheres of 6 mice for rDA1m. n=15 trials from 3 hemispheres of 3 mice for rDA1h. n=30 trials from 6 hemispheres of 3 mice for DA2m. n=25 trials from 5 hemispheres of 4 mice for DA2h. Two-tailed Student’s t-test was performed. h, p=0.6066 (n.s.) between baseline and MPH; p=0.7130 (n.s.) between baseline and Etic; p=0.3216 (n.s.) between MPH and Etic. i, left, p=1.27×10⁻¹⁶ (***); right, p=2.98×10⁻¹⁵ (***). j, left, p=7.07×10⁻¹⁰ (***); right, p=0.0034 (**). k, left, p=7.86×10⁻²¹ (***); right, p=1.07×10⁻⁶ (***). l, left, p=1.86×10⁻²⁵ (***); right, p=2.06×10⁻⁷ (***).
Average traces shaded with ± s.e.m. are shown in c-g. Data are presented as the mean ± s.e.m. in h-l.