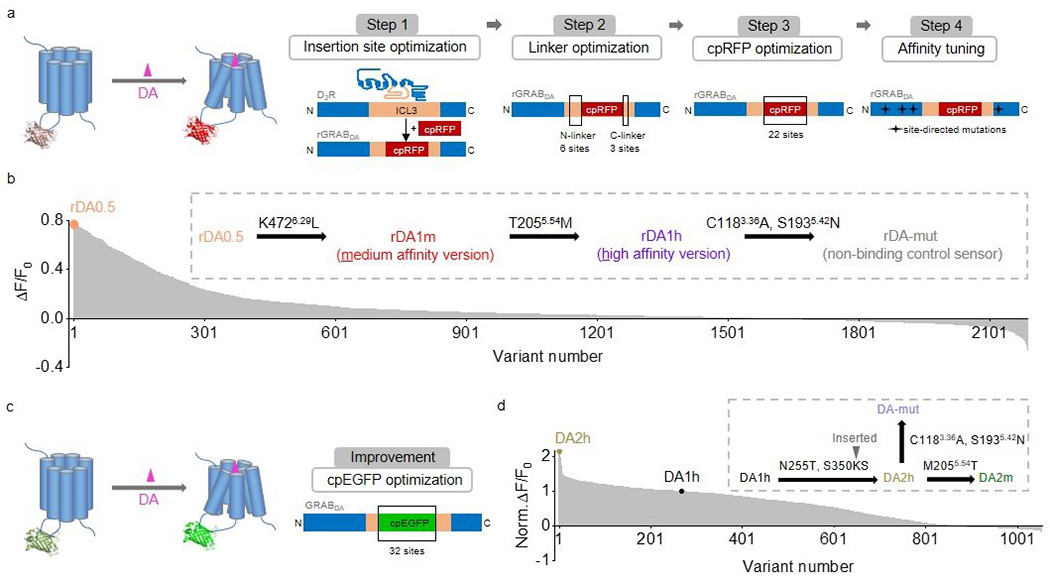
Extended Data Fig. 1. The development of red fluorescent DA sensors and second-generation green fluorescent DA sensors.

a, Schematic illustration showing the design and optimization of the red fluorescent GRABDA sensors.
b, The response to 100 μM DA measured for red fluorescent DA sensor variants during steps 1‒3. The variant with the highest fluorescence change (named rDA0.5) was then sequentially mutated as shown to generate rDA1m, rDA1h, and rDA-mut.
c, Schematic illustration showing the design and optimization of the green fluorescent GRABDA sensors.
d, Normalized ΔF/F0 in response to 100 μM DA measured for green fluorescent DA sensor variants, normalized to the first-generation DA1h sensor. DA2h was then mutated as shown to generate DA2m and DA-mut.
The superscripts in the insets of b,d are based on the Ballesteros–Weinstein numbering scheme54, indicating the mutation sites in the D2R.
