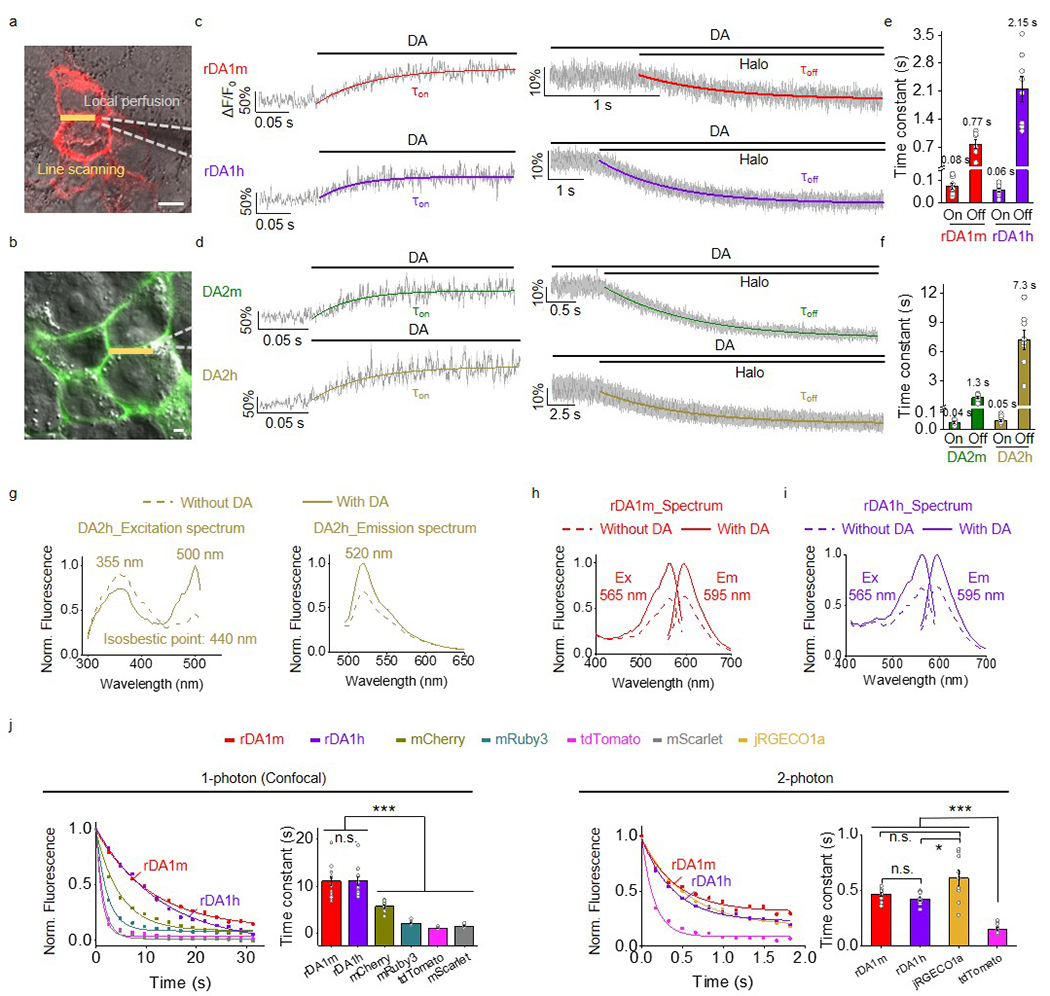
Extended Data Fig. 3. Characterization of the sensors in HEK293T cells.

a,b, Schematic illustration showing the local perfusion system. Scale bars, 10 μm.
c,d, Representative traces showing the response to DA (left) and subsequent addition of Halo (right). The traces were the average of 3 different regions of interest (ROIs) on the scanning line, shaded with ± s.e.m.. Each trace was fitted with a single-exponential function to determine τon (left) and τoff (right). Similar results were observed for 7-10 cells.
e,f, Group summary of τon and τoff. n=10, 7, 9, 8, 10, 8, 10, 8 cells for rDA1m (τon), rDA1m (τoff), rDA1h (τon), rDA1h (τoff), DA2m (τon), DA2m (τoff), DA2h (τon), DA2h (τoff).
g-i, Excitation and emission spectra for the indicated sensors in the absence and presence of DA.
j, Photostability of rDA1m and rDA1h (in the presence of 100 μM DA) and the indicated fluorescent proteins was measured using 1-photon and 2-photon microscopy. Each photobleaching curve was fitted to a single-exponential function to determine the time constant. 1-photon, n=12 cells each. 2-photon, n=10, 10, 9, 10 cells for rDA1m, rDA1h, jRGECO1a, tdTomato. Two-tailed Student’s t-test was performed. 1-photon, p=0.9755 (n.s.) between rDA1m and rDA1h; p=2.72×10⁻⁵ (***) between rDA1m and mCherry; p=7.10×10⁻⁹ (***) between rDA1m and mRuby3; p=7.90×10⁻¹⁰ (***) between rDA1m and tdTomato; p=1.95×10⁻⁹ (***) between rDA1m and mScarlet; p=1.28×10⁻⁵ (***) between rDA1h and mCherry; p=2.50×10⁻⁹ (***) between rDA1h and mRuby3; p=2.66×10⁻¹⁰ (***) between rDA1h and tdTomato; p=6.75×10⁻¹⁰ (***) between rDA1h and mScarlet. 2-photon, p=0.0963 (n.s.) between rDA1m and rDA1h; p=0.0511 (n.s.) between rDA1m and jRGECO1a; p=0.0139 (*) between rDA1h and jRGECO1a; p=2.82×10⁻¹¹ (***) between rDA1m and tdTomato; p=1.71×10⁻¹⁰ (***) between rDA1h and tdTomato; p=2.96×10⁻⁶ (***) between jRGECO1a and tdTomato.
Data are presented as the mean ± s.e.m. in e, f, j (bar graph).
