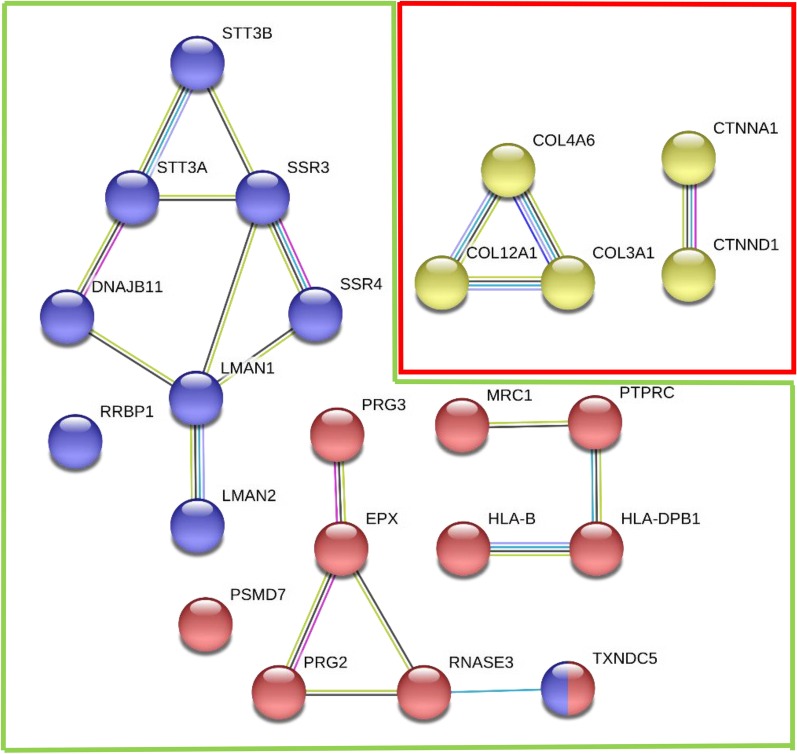
Fig. 2.
Diseased HIC samples exhibited increased expression of immune response and ER stress proteins, with a decrease in cellular adhesion proteins. Association map for proteins differentially expressed in diseased Hunner’s IC biopsies compared to diseased non-Hunner’s IC biopsies. Nodes in the green box represent proteins with increased expression in diseased HIC tissue, while nodes within the red outline represent proteins with decreased expression. Red nodes represent proteins with an immune response function, blue represents ER protein processing/stress response, and yellow represent cellular adhesive proteins. Lines between nodes indicate reported associations as detailed in “Methods” section

