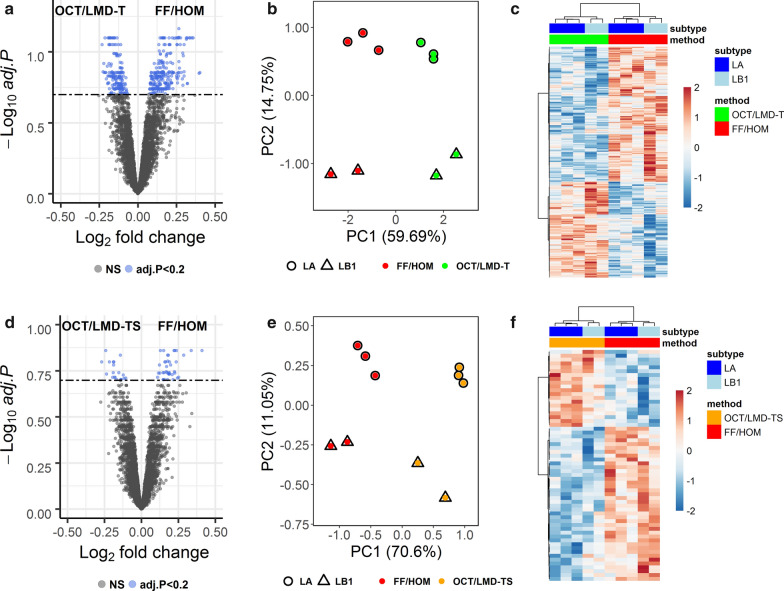
Fig. 3.
Differentially enriched GO terms between FF/HOM and OCT/LMD samples. a–c FF/HOM vs. OCT/LMD-T and d–f FF/HOM vs. OCT/LMD-TS. a, d Volcano plots showing the distribution of fold changes of GO term abundance and adjusted p-value for each comparison. NS, not significant, here denoting adj. p-value ≥ 0.2. b, e PCA analysis of 402 and 60 significant GO terms, respectively. c, f Heat maps generated using unsupervised clustering analysis with 402 and 60 significant GO terms, respectively. Each column represents one sample, each row represents a significant GO term. LA, luminal A; LB1, luminal B1

