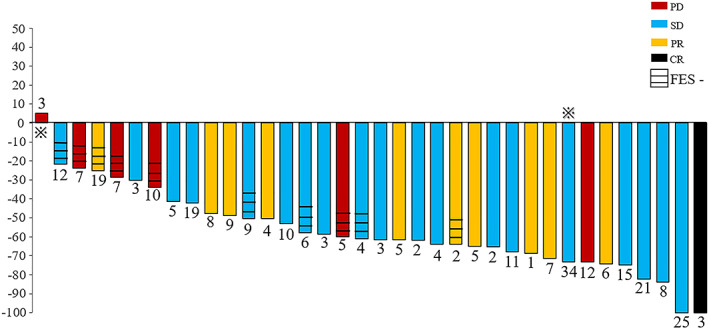
Figure 3.

Waterfall plot showing the relative changes in tumor 18F‐FES uptake in individual patients treated with 500 mg of fulvestrant on follow‐up scans compared with baseline. FES ‐, presence of 18F‐FES negative lesion(s). The number on each bar represents the number of lesions per patient.  , the patient is also presented in Figure 4.Abbreviations: CR, complete response; FES, fluoroestradiol; PD, progressive disease; PR, partial response; SD, stable disease.
