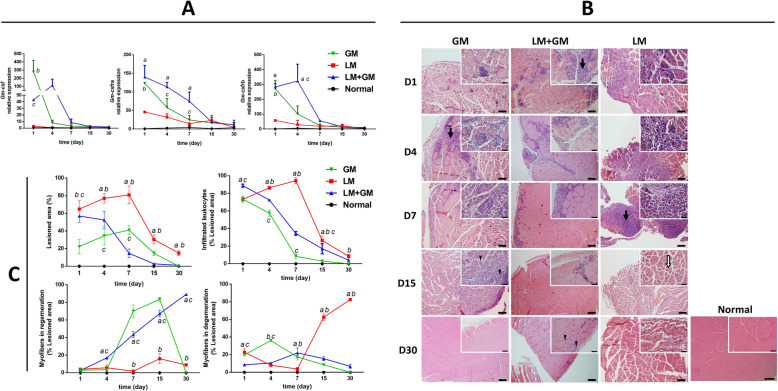
Fig. 2.
uP-mGM transfection promotes decreased inflammation. a Relative gene expression of GM-CSF and the GM-CSFR2 receptor assessed by quantitative RT-PCR. Two-way ANOVA and Tukey’s post hoc test. “a” p < 0.05 LM vs LM+GM; “b” p < 0.05 LM vs GM; “c” p < 0.05 LM+GM vs GM. b Micrographs of TA skeletal muscle tissue stained with HE. GM, healthy mouse treated with GM-CSF; LM, injured mouse without treatment; LM+GM, injured mouse treated with GM-CSF. Bar = 100 μm. Insets show × 400 magnified areas are shown in each figure. Bar = 50 μm. Leukocyte infiltrate, black arrow; atrophy, white arrow; cells with central nucleus, black arrowhead; cell necrosis, white arrowhead. c Histomorphometry was carried out using 20 images within the injured area per slide of each animal after HE staining. Data are presented in % (mean ± SD) of each parameter/total analyzed area. Two-way ANOVA and Tukey’s post hoc test. “a” p < 0.05 LM vs LM+GM; “b” p < 0.05 LM vs GM; “c” p < 0.05 LM+GM vs GM

