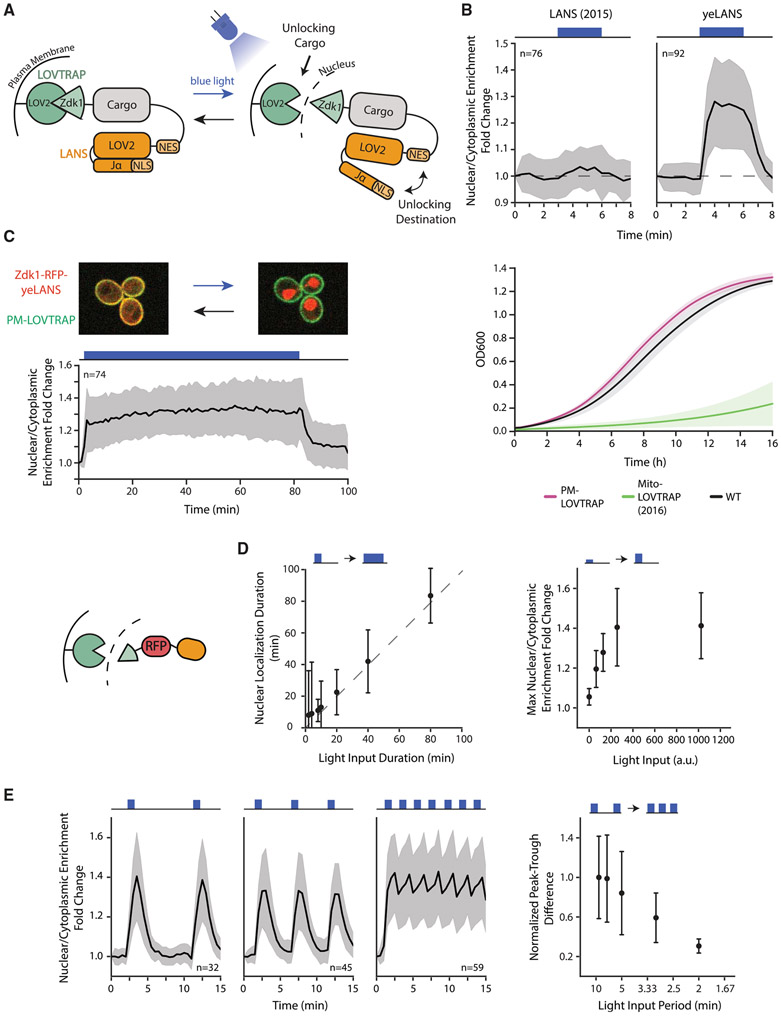
Figure 1. Design, Optimization, and Characterization of CLASP.
(A) Schematic illustrating CLASP mechanism.
(B) Optimization of LANS NLS (top panels) and LOVTRAP localization (bottom panel). Top panels show the mean value of nuclear/cytoplasmic enrichment fold change for original NLS and optimized NLS (yeLANS) as a function of time when given a pulse of blue light. Nuclear/Cytoplasmic enrichment fold change is calculated relative to the nuclear/cytoplasmic enrichment at t = 0. Bottom panel shows the mean of OD600 in 3 independent growth experiments for original LOVTRAP targeted to mitochondria and the optimized plasma membrane-targeted LOVTRAP.
(C) (Top panel) Confocal microscopy image showing mScarlet-CLASP localization at the plasma membrane in the dark (left) and in the nucleus (right) after 3 min of light exposure. Images are an overlay of the mCherry and Cy7 channels. (Bottom panel) Quantification of mean nuclear/cytoplasmic enrichment fold change of mScarlet-CLASP as a function of time in response to a prolonged light input (80 min, 1024 a.u. light input amplitude). Blackline represents the mean of 74 cells.
(D) Quantification of the response of mScarlet-CLASP to light inputs with different dynamic characteristics. The left plot shows median time to return within 25% of basal nuclear/cytoplasmic enrichment for light pulses of different durations and constant 1,024-a.u. amplitude. Median is used to minimize the effect of outliers. The dotted line is Y = X line. The right plot shows the mean response to 1 min light pulses of different amplitudes. Points in both plots represent at least 21 cells.
(E) Nuclear/cytoplasmic enrichment fold change of mScarlet-CLASP in response to light pulsing with different periods. Left three graphs show mean enrichment fold change as a function of time in response to pulsed light inputs (1 min light given in a 9, 5, or 2 min period, respectively) with 1,024-a.u. amplitude. The right plot quantifies median peak-to-trough difference (normalized to the median peak-to-trough difference generated by the longest period). Median is used to minimize the effect of outliers. Each point in the right plot represents at least 32 cells. Error bars and shaded area except where noted, represent standard deviation to show the spread of the data. For all panels, n represents the number of cells tracked and light input regimes are depicted on top of panels. Cartoon (left of D) represents mScarlet-CLASP. yeLANS—yeast enhanced LANS, PM-LOVTRAP—plasma membrane LOVTRAP, Mito-LOVTRAP—mitochondrial LOVTRAP. See also Figures S1 and S2.

