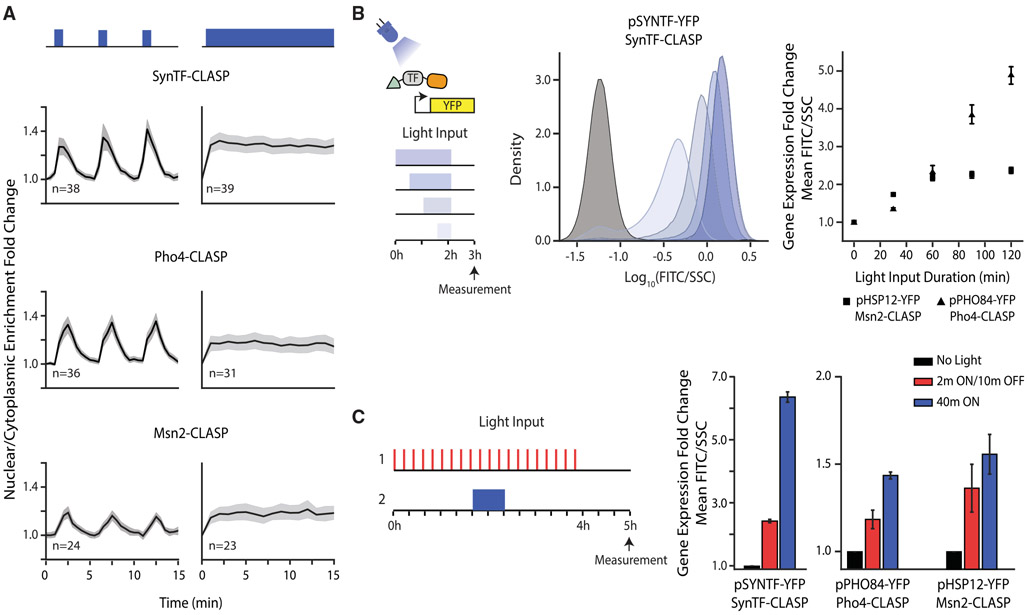
Figure 2. CLASP Can be Used to Control Localization of Many Transcription Factor Cargos.
(A) Nuclear/cytoplasmic enrichment fold change in response to pulsed (left panels) and continuous light (right panels) for several TF-CLASP cargos. Graph shows mean of single-cell traces for TFs tagged with CLASP. Light is delivered for one minute at the start of each 5-min period or continuously. The shaded gray area represents 95% confidence interval and light inputs are represented in blue above graphs. n represents number of cells tracked.
(B) Fluorescent reporter expression due to TF-CLASP localization. The left panel shows a schematic of the experiment—the TF is localized to the nucleus for 0.5, 1, 1.5, or 2 h. A fluorescent reporter is measured via flow cytometry 1 h after light shut-off. Center panel shows the population response of pSYNTF-YFP (promoter downstream of SynTF-CLASP) for inputs shown on the left. Darker blue shades correspond to longer light duration. The black histogram corresponds to no light. The right panel shows quantification of the YFP fold change as a function of light duration for promoters responsive to other TF-CLASP constructs following the same experimental protocol. Fluorescence readings are normalized by side scatter and then normalized to the 0 min dose for each strain to show fold change. Error bars represent standard error of the mean for 9 biologically independent replicates.
(C) Fluorescent reporter response to pulsatile versus continuous localization of different TF-CLASP constructs. TF-CLASP constructs are given either 20 2-min pulses of light or 1 40-min pulse of light, as depicted in the schematic on the left. Reporter expression is measured via flow cytometry 1 h after light shut-off. Right panels show quantification of YFP fold change in response to pulsed light input, continuous light input, or no input. Error bars represent standard error of the mean for 9 biologically independent replicates. In all panels, strains are induced with a given amplitude of light (SynTF-CLASP – 1,024 a.u.; Msn2-CLASP – 2,048 a.u., Pho4-CLASP – 4,095 a.u.). See also Figure S3.

