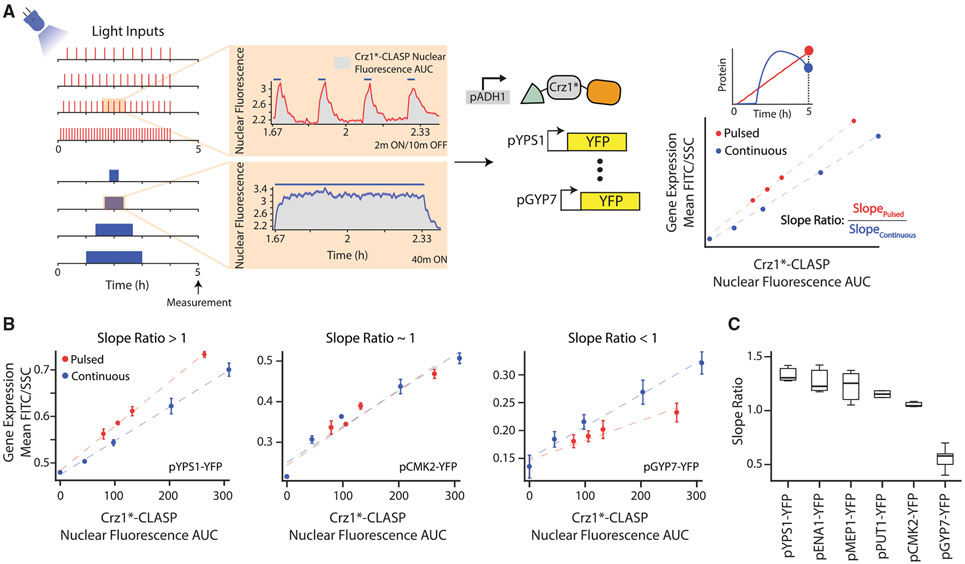
Figure 3. Crz1 Target Genes Show Differing Interpretation of Crz1*-CLASP Short Nucleoplasmic Pulses.
(A) Schematic of the experimental setup used. Two types of light inputs are given to cells expressing Crz1*-CLASP: 2 min pulses with decreasing periods (20, 15, 12, and 6 min periods) and single pulses with increasing durations (20, 40, 80, 120 min). Light-induced Crz1*-CLASP nuclear localization is measured with fluorescence microscopy. The mean of single-cell fluorescence values is plotted (solid red for pulsed input or blue line for continuous inputs), with the shaded area representing 95% confidence interval (red or blue shading). Cells tracked for the pulsed and continuous inputs are 187 and 91 cells, respectively. Crz1*-CLASP nuclear fluorescence AUC (x-axis in a rightmost panel) is quantified as the area under the nuclear fluorescence traces (gray shading in middle panel). Gene expression (mean FITC/SSC) is measured for 6 promoter fusions of target gene driving a fluorescent protein (YFP) at 5 h after light input. A schematic shows gene-expression values for different light input regimes are plotted as a function of nuclear fluorescence AUC, generating the output-fluorescence plot referred to in the text. Each point in the plot is an endpoint measurement of gene expression, as highlighted by the YFP time course schematic above. Red circles represent output fluorescence for short 2 min pulses with an increasing period, and blue circles represent that for continuous single pulse with increasing durations. A best-fit line (red for pulsed inputs and blue for continuous inputs) is fit through the data points for the pulsed and continuous inputs. For each output-fluorescence plot we define the slope ratio as the ratio of the slope of the pulsed to continuous best-fit lines.
(B) Output-fluorescence plot, for three representative Crz1 target promoters pYPS1-YFP, pCMK2-YFP, and pGYP7-YFP. The error bars are the standard deviation of at least 3 biological replicates.
(C) Slope ratios for 6 Crz1 target genes plotted in order of highest to lowest slope ratio. Data for 3 biological replicates are plotted. In all panels, Crz1*-CLASP is induced with a 512 a.u. light input. See also Figure S4.

