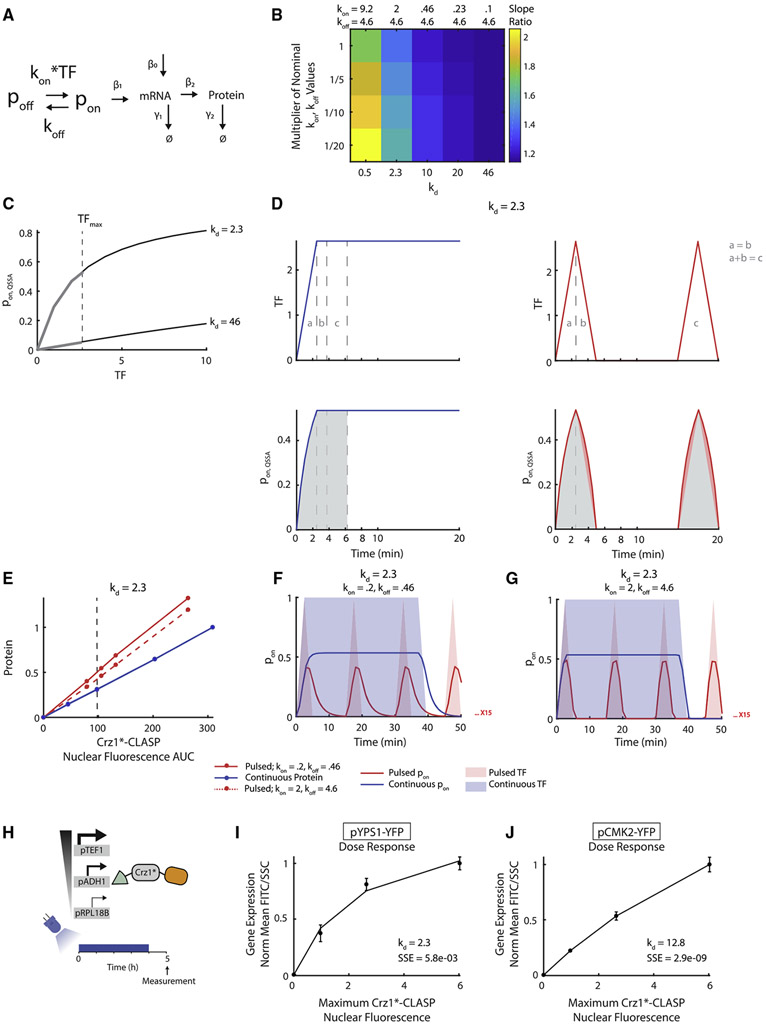
Figure 4. Higher Gene Expression in Response to Short Pulses by Promoters Occurs when the Dose Response Is Saturated at Low TF Concentration.
(A) Schematic of a two-state promoter model, where the input is Crz1*-CLASP nuclear localization (TF) and the output is fluorescent protein level (Protein). The promoter turns ON with rate constant kon and turns OFF with rate constant koff.
(B) Heatmap of slope ratio for increasing kd and different values of kon and koff. Each column has a given value of kd and each row has different values for kon and koff that produce the same kd. The nominal kon and koff values used in the first row are noted at the top of each column, and every subsequent row uses a fraction of these values (1/5, 1/10, and 1/20). The values of β1, β2 and β0 are 2.01, 4.92, and 0.0032, respectively.
(C) The plot of pon as a function of TF for kd = 2.3 and 46, assuming a fast promoter. This quantity is denoted as pon, QSSA, and calculated as pon, QSSA = TF/(TF+ kd). The dotted line represents max TF input, TFmax, which is 2.6.
(D) The plot of pon, QSSA as a function of time assuming quasi-steady state of promoter dynamics as in panel (C). In these panels, kd = 2.3. (Top panels) Red and blue lines represent pulsed and continuous TF inputs, respectively. Gray lines and text denote the equivalent area of TF input. The area labeled “a” represents the rise for both pulsed and continuous inputs. The area labeled “b” represents the fall of the pulsed input, and the equivalent area for the continuous input. The area labeled “c” represents a single pulse of the pulsed input, and the equivalent area of the continuous input. The area labeled “c” is equivalent to the sum of the areas labeled “a” and “b.” The areas labeled “a” and “b” are equivalent to each other. (Bottom panels) Red and blue lines represent pon, QSSA in response to pulsed and continuous TF inputs, respectively. Gray shading denotes the equivalent area of pon, QSSA for continuous and pulsed inputs. Light red shading denotes excess pon, QSSA area resulting from the rise and fall of the pulsed input.
(E) Output-fluorescence plots generated by the model for two parameter sets that qualitatively represent pYPS1-YFP. The solid lines represent kon = 0.2 and koff = 0.46. The dashed lines represent kon = 2 and koff = 4.6, and kd = koff/kon = 2.3 for both parameter sets. The red lines represent the output of the pulsed input. The blue lines represent the output of the continuous input; for both parameter sets, this output is the same.
(F) Plot of pon as a function of time for continuous and pulsed inputs for kd = 2.3 with kon = 0.2, koff = 0.46. Red and blue solid lines represent the pon resulting from pulsed and continuous inputs, respectively. The red and blue shading represents pulsed and continuous TF inputs, respectively.
(G) Same as (F) for kon = 2, koff = 4.6.
(H) Schematic of dose-response experiment. Cells with different expression levels of Crz1*-CLASP are induced with light for 4 h and YFP expression is measured after 5 h.
(I) The experimental dose response for pYPS1-YFP was fit to the equation: normalized protein output = C×TF/(TF + kd) where TF = maximum Crz1*-CLASP nuclear fluorescence, C = scaling factor, and kd = koff/kon. kd and squared error of prediction (SSE) of the fit for each gene is noted in the bottom right corner of the plot.
(J) Same as (I) for pCMK2-YFP. for (I and J), error bars represent the standard deviation of 3 biologically independent replicates. See also Figures S5, S8, and S9.

