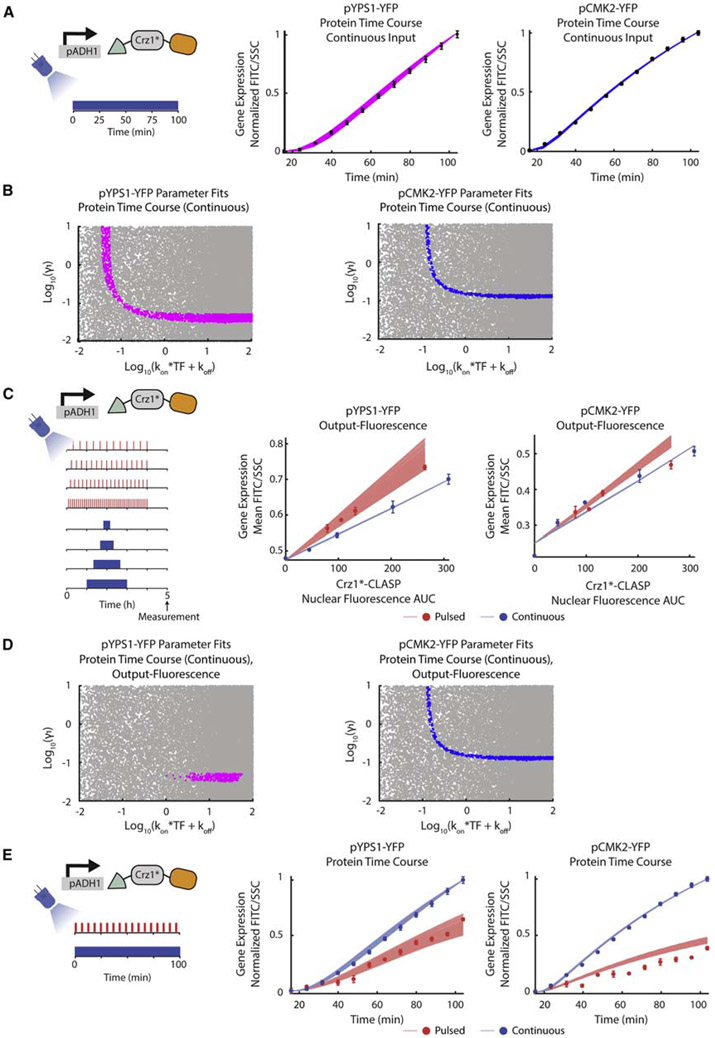
Figure 5. Time Course Measurements of Protein Output Constrain Parameter Relationships.
(A) (Left panel) Schematic of the input used for protein time course experiment. Cells are induced with constant blue light and pYPS1-YFP or pCMK2-YFP expression is measured continuously (every 8 min) throughout induction for 2 h. (Middle panel) Plot of normalized protein expression (FITC/SSC) as a function of time for pYPS1-YFP. The magenta lines represent fits through the data (plotted as black dots with error bars) for the model in Figure 4A. The model was simulated using 33,000 parameter sets varying kon, koff, and γ1, and fit to the dynamic gene-expression data was assessed. kon was varied from 0.001–10, koff from 0.000007–100, and γ1 from 0.01–10. (Right panel) Same as a middle panel for pCMK2-YFP. For both panels, β1 was set to 0.1, β2 set to 0.06, γ2 set to 0.0083, and β0 set to 0.001. For middle and right panels, error bars represent standard deviation of 3 biologically independent replicates.
(B) (Left panel) Plot of log10(γ1) as a function of log10(kon×TF+koff) for pYPS1-YFP. Magenta dots represent 2,355 parameter fits to the dynamic protein time course data (continuous input) as discussed in Figure 5A middle panel. Gray dots represent parameters that were tested but did not fit the data. (Right panel) Same as left panel for pCMK2-YFP. Blue dots represent 807 parameter fits to the dynamic protein time course data (continuous input) as discussed in Figure 5A right panel. Gray dots represent parameters that were tested but did not fit the data.
(C) (Left panel) Schematic of input for the output-fluorescence experiment. The experiment is as described in Figure 3A. (Middle panel) Output-fluorescence plot of simulated outputs and data for pYPS1-YFP. Parameters determined to fit the dynamic protein time course with a continuous input are used to predict the output-fluorescence data. Red and blue lines represent the model outputs for all parameters that fit the output-fluorescence and protein time course data from (A). Red and blue circles and error bars represent experimentally measured means and standard deviations for pulsed and continuous inputs, respectively, for 3 biologically independent replicates. (Right panel) Same as the middle panel for pCMK2-YFP.
(D) (Left panel) Plot of log10(γ1) as a function of log10(kon×TF+koff) for pYPS1-YFP, where the magenta dots represent 300 parameters that fit both the output-fluorescence and dynamic protein time course (continuous input). Gray dots represent parameters that were tested but did not fit to the data. (Right panel) Same as the left panel for pCMK2-YFP. The blue dots represent 321 parameters that fit both the output-fluorescence and dynamic protein time course data (continuous input).
(E) (Left panel) Schematic of input for protein time course experiment for pulsed and continuous inputs. Cells were induced with either constant light or pulsed light (2 min ON/4 min OFF) and gene expression was measured every 8 min. (Middle panel) Plot of normalized protein expression (FITC/SSC) as a function of time for pYPS1-YFP for the experiment denoted in the left panel. Red and blue circles and error bars denote experimentally measured means and standard deviations for pulsed and continuous inputs, respectively, for 3 biologically independent replicates. Red and blue lines represent the model outputs for the experiment denoted in the left panel, using parameters that fit the dynamic protein time course (continuous input) and output-fluorescence data. (Right panel) Same as left panel for pCMK2-YFP. See also Figure S8.

