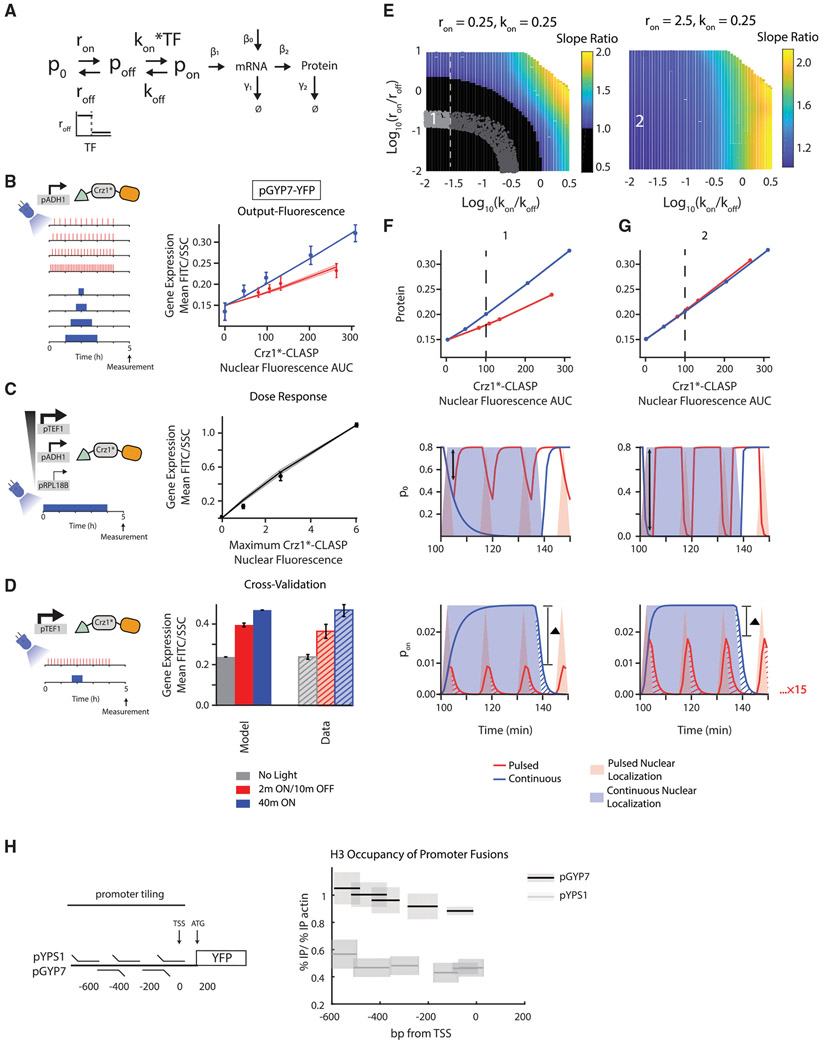
Figure 6. Higher Gene Expression in Response to Continuous Inputs by Promoters Can be Explained by a Model with Two Transition States and with a Thresholded Transition between Non-transcribing Promoter States.
(A) Schematic of the three-state model where roff, the inactivation rate constant from p0 to poff, is thresholded by TF concentration and where the activation from poff to pon is linearly dependent on TF.
(B) (Left panel) Schematic of the experimental setup. (Right panel) Output-fluorescence plot for pGYP7-YFP. Circles are experimentally measured values while lines denote the mean model output for 96 parameter sets that fit the data points within the error bars, the same metric as used in Figure 5. The solid line denotes the mean and shaded areas denote the standard deviation of the model outputs for these parameter sets. Parameters were sampled (ron from 0.1–100, roff from 0.1–100, kon from 0.0001–1, koff from 0.0001–1, β1 from 0.0001–10, β0 from 0.000001–0.01, threshold from 0–0.5) or set (β2 = 0.06, γ1 = 0.05, γ2 = 0.0083). Red circles, error bars, and lines relate to the pulsed input, while blue circles, error bars, and lines relate to the continuous input. Error bars show standard deviation from 3 biologically independent replicates.
(C) (Left panel) Schematic of the experimental setup. (Right panel) Dose-response plot for pGYP7-YFP. The parameters that fit the output-fluorescence data were used to further fit the dose response of pGYP7-YFP using a least squared error criterion (25 parameter sets). Solid black line is the mean generated by the model. The black circles are the mean of the experimentally measured dose response and error bars are the standard deviation of 3 biologically independent replicates.
(D) (Left panel) Schematic of the experimental setup. (Right panel) The parameters that fit the output-fluorescence are subjected to cross-validation using an experiment where Crz1*-CLASP expression is increased (construct expressed from a pTEF1 promoter), and cells are exposed to either short-pulsed (2 min ON/10 min OFF) or continuous input (40 min of light). The model generated outputs (solid gray, red, and blue bars) are plotted with the experimental data (hashed gray, red, and blue bars). The gray bars correspond to no light input. The error bars are the standard deviation of 3 biological replicates.
(E) (Left panel) Heatmap shown in the log10(kon/koff)-log10(ron/roff) plane of slope ratio of output-fluorescence relationship resulting from the model in (A). Parameters are sampled (roff from 0.0025-25, koff from 0.0025–25) or set (ron = 0.25, kon = 0.25, β1 = 0.0001, β2 =0.06, γ1=0.05, γ2 =0.0083, threshold = 0.5, β0 = 0.000001). Point 1 highlights a parameter set that fits the output-fluorescence, dose response, and cross-validation datasets for pGYP7-YFP. Black region is where slope ratio < 1. Gray dotted line indicates when log10(kon/koff) ≅ −1.5, at which point the dose-response changes from linear to nonlinear with increase in the log10(kon/koff) value. All parameters that show a qualitative fit to output-fluorescence data are displayed as light and dark gray dots. The light gray dots represent parameter sets where all pGYP7-YFP data are quantitatively fit. (Right panel) Heatmap of slope ratio as in (E, left panel) with a ron = 2.5, 10 times larger than that in (E, left panel). kon is also set to 0.25. Parameters are sampled (roff from 0.025-250, koff from 0.0025-25) or set (β2 = 0.0001, β2 = 0.06, γ1 = 0.05, γ2 = 0.0083, threshold = 0.5, β0 = 0.000001). Point 2 highlights the effect of increasing both ron and roff while maintaining the ratio log10(ron/roff).
(F and G) (Upper panels) Output-fluorescence plots generated by the model for different parameter sets that correspond to points 1 and 2 in the heatmaps of (E). The slope ratio for point 1 is 0.51 with log10(kon/koff) = −1.58 and log10(ron/roff) = −0.89. The slope ratio for point 2 is 1.04 with log10(kon/koff) = −1.58 and log10(ron/roff) = −0.89. (Middle panels) Example of a time course of promoter state p0 for a light input that produces the equivalent of 40 min (dotted line in upper panel) in nuclear localization either continuously or in short pulses. Solid lines are the p0 pulses while shading denotes TF nuclear localization. The black double arrows denote the maximum depletion of the p0 state for the pulsed input. (Lower panels) Example of a time course of promoter activity pon for a light input that produces the equivalent of 40 min (dotted line in upper panel) in nuclear localization either continuously or in short pulses, similar to middle panels. The red and blue hashes represent residual promoter activity beyond the TF nuclear localization input. The red residual promoter activity is repeated 15 times while the blue residual activity is repeated one time. The ▲ bar denotes the difference between the amplitudes generated by the 2 min pulsed and 40-min continuous input.
(H) (Left panel) Schematic of chromatin immunoprecipitation experiment. (Right panel) H3 histone occupancy is plotted for regions of the promoter fusions pYPS1-YFP and pGYP7-YFP. H3 histone occupancy is calculated as the ratio of % immunoprecipitation (% IP) of the promoter fusion target to % immunoprecipitation of an actin control. % immunoprecipitation is calculated relative to the input DNA. Black lines show the mean measured value and gray shading shows the standard deviation of 3 biologically independent replicates. See also Figures S6 and S7.

