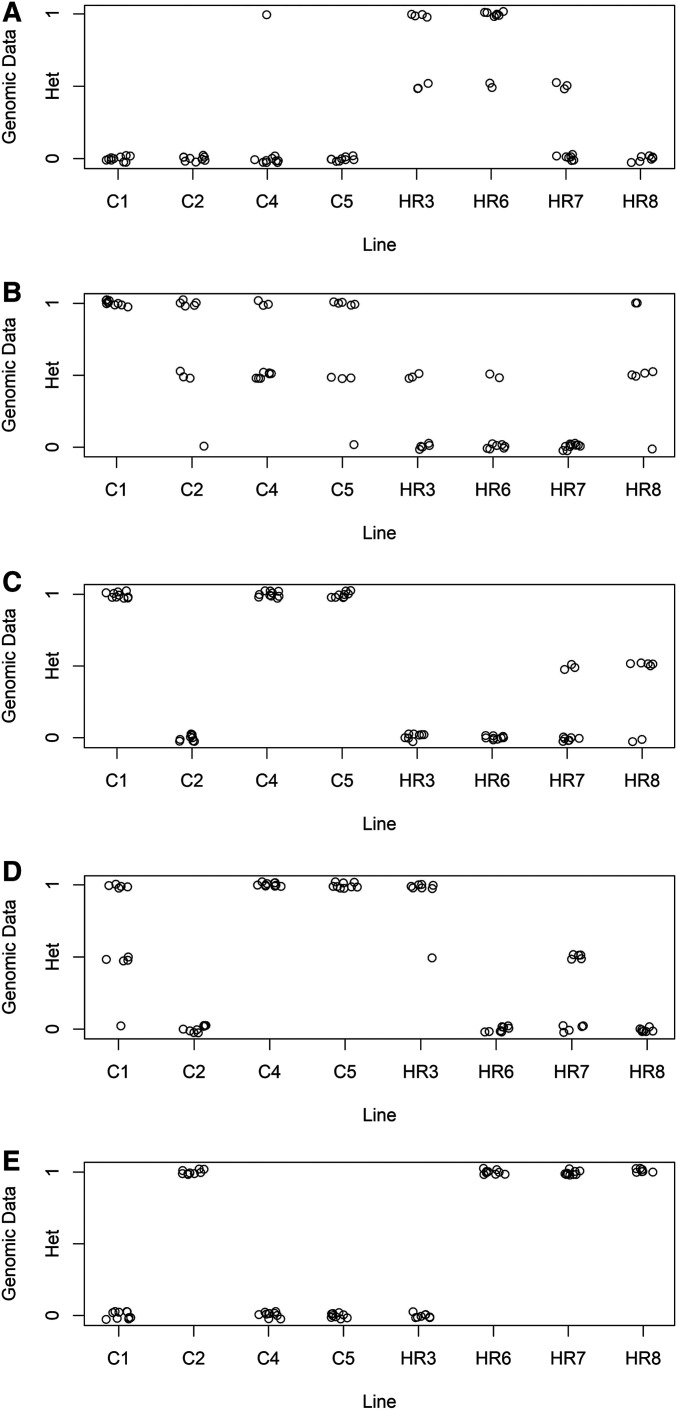
Figure 3.
These are images of different variance structures depicted by actual examples from the MegaMUGA data (Xu and Garland 2017). This includes example data that were best fit by the “Full” model, marker = JAX00157775, P = 0.1008 (A), “SepVarInd” model, marker = UNC25816949, P = 0.006754 (B), “SepVarLines” model, marker = JAX00170011, P =0.04885 (C), the “Simple” model, marker = UNC080521812, P = 0.2687 (D), or has no within line variance, thus not fitting any model, marker = backupJAX00272176 (E).

