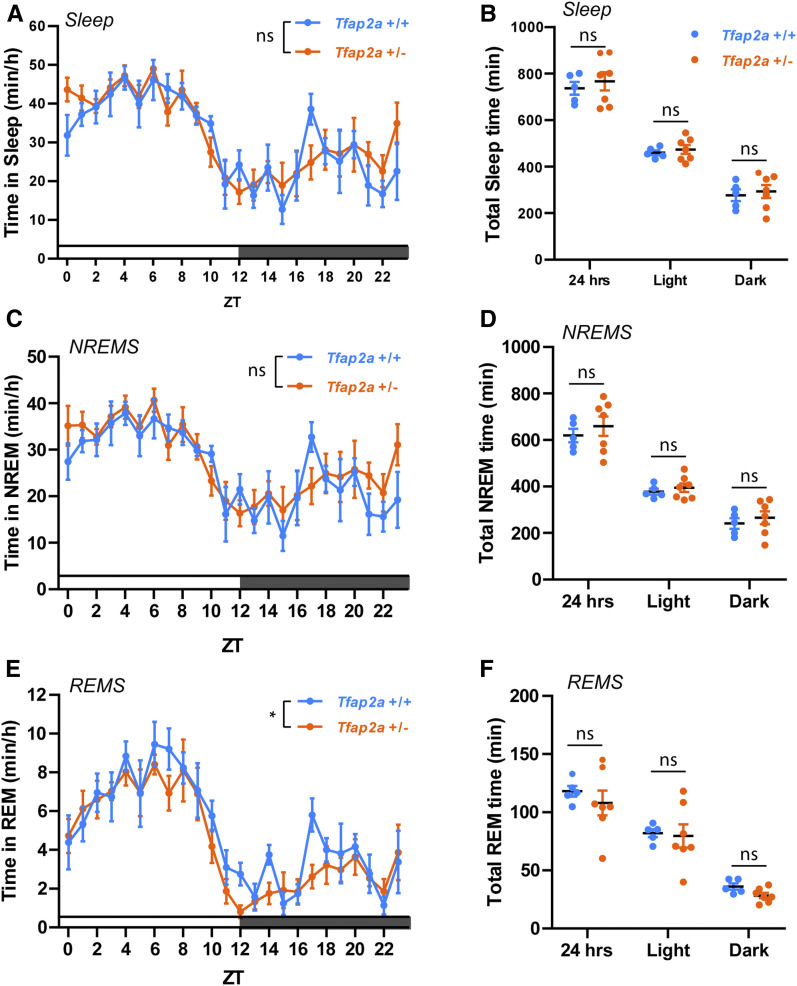
Figure 1.
Sleep amount is not significantly altered in Tfap2a+/− mice. (A) Total sleep quantification over Zeitgeber times (ZT), two-way ANOVA followed by Sidak’s multiple comparisons test, the main effect of genotype, F (1,240) = 0.941, P = 0.333. (B) Total sleep time quantification, P = 0.576; light, P = 0.574; dark, P = 0.687. (C) NREMS quantification over ZT, two-way ANOVA followed by Sidak’s multiple comparisons test, the main effect of genotype, F (1,10) = 0.526, P = 0.485. (D) NREMS time quantification, P = 0.446; light, P = 0.521; dark, P = 0.543. (E) REMS quantification over ZT, two-way ANOVA followed by Sidak’s multiple comparisons test, the main effect of genotype, F (1,239) = 0.492, *P = 0.0353. (F) REMS time quantification, P = 0.466; light, P = 0.852; dark, P = 0.053. n = 5 for Tfap2a+/+, n = 7 for Tfap2a+/−. Two-tailed unpaired t-tests were used for (B, D, and F). Averaged data are shown as the mean ± SEM.

