Figure 11.
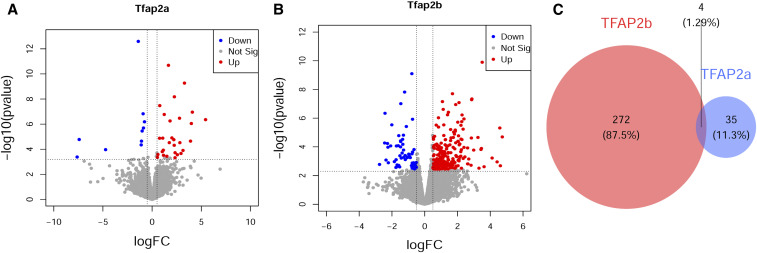
Divergent gene expression changes in Tfap2a+/− and Tfap2b+/−. (A) Volcano plot of genes that are differentially expressed in Tfap2a+/− mice. (B) Volcano plot of genes that are differentially expressed in Tfap2b+/− mice. (C) Venn diagram showing distinct and overlapping genes that are differentially expressed [false discovery rate (FDR) < 0.20] in Tfap2a+/− and Tfap2b+/−. The overlapping P value was calculated using Fischer’s Exact tests, P = 0.005. n = 3 for B6N, n = 3 for Tfap2a+/−, n = 3 for Tfap2b+/−. Genes that are differentially expressed at FDR < 0.20 and logFC > 0.5 are highlighted and labeled in the volcano plot.

