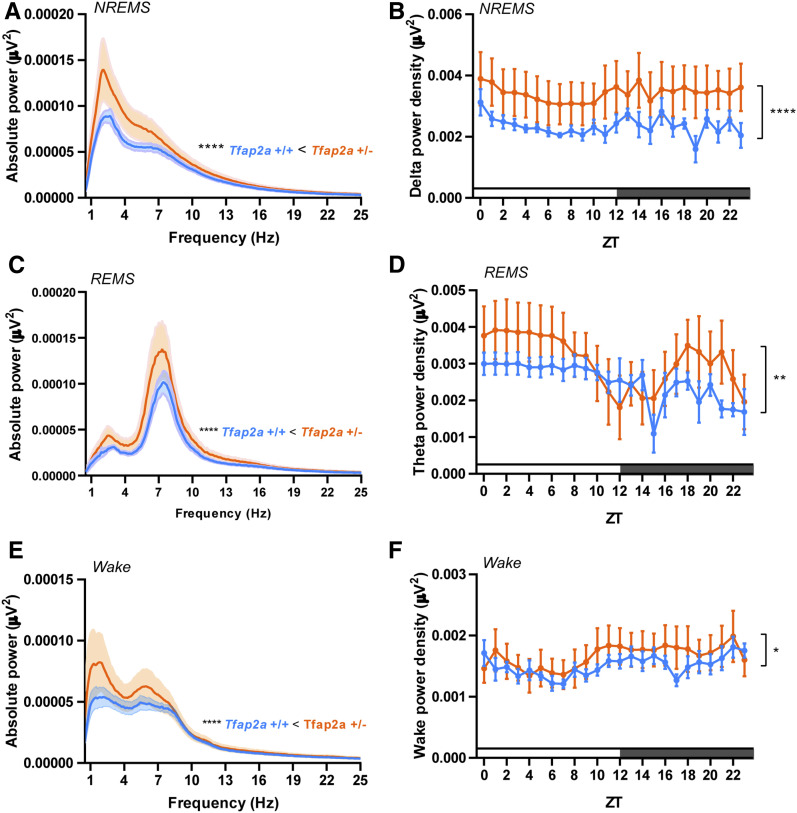
Figure 2.
EEG delta and theta power are increased in Tfap2a+/− mice. (A) EEG power spectra in NREMS. (B) NREMS delta power (1–4 Hz), two-way ANOVA followed by Sidak’s multiple comparisons test, the main effect of genotype, F (1,240) = 29.58, ****P < 0.0001. (C) EEG power spectra in REMS. (D) REMS theta power (6–10 Hz): two-way ANOVA followed by Sidak’s multiple comparisons test, the main effect of genotype, F (1,240) = 7.558, **P = 0.0064. (E) EEG power spectra during wakefulness. (F) Power analysis during wake (0.5–4 Hz), two-way ANOVA followed by Sidak’s multiple comparisons test, the main effect of genotype, F (1,240) = 4.028, *P = 0.0459. All data are shown as the mean ± SEM n = 5 for Tfap2a+/+, n = 7 for Tfap2a+/−. P values for 1–25 Hz were calculated using Wilcoxon two-sided signed-rank test, ****P < 0.0001. All data are shown as the mean ± SEM.

