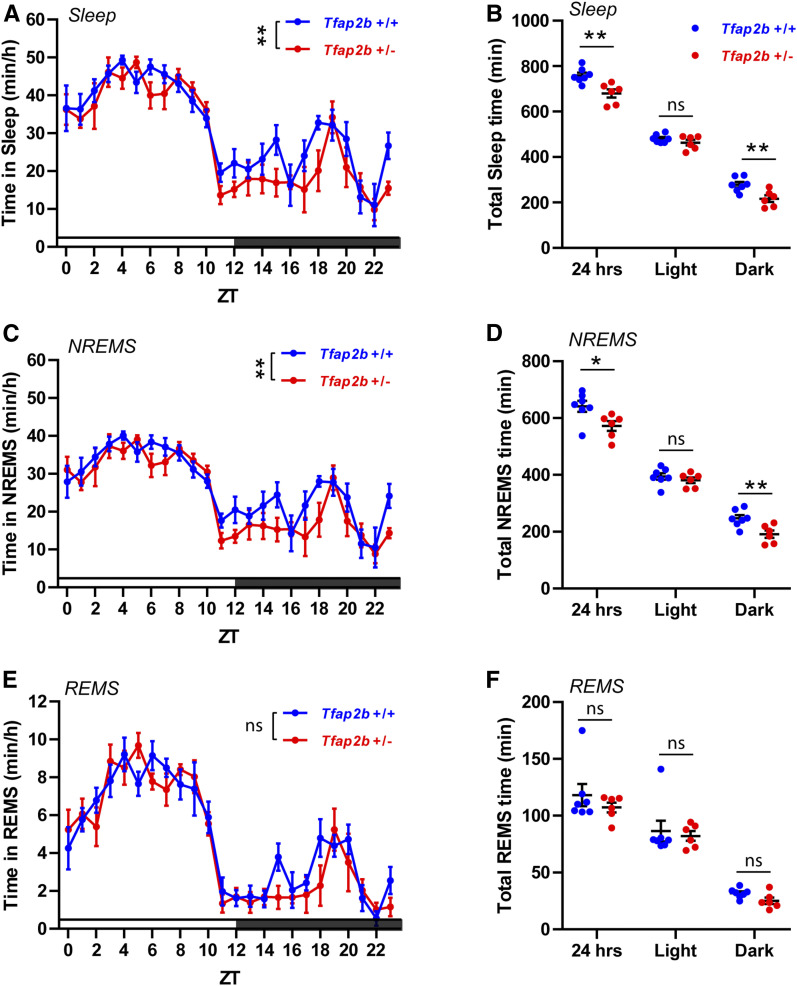
Figure 3.
Sleep during the dark phase is reduced in Tfap2b+/− mice. (A) Total sleep time quantification over ZT, two-way ANOVA followed by Sidak’s multiple comparisons test, the main effect of genotype, F (1,264) = 10.01, **P = 0.002. (B) Total sleep time quantification, **P = 0.004; light, P = 0.222; dark, **P = 0.007. (C) NREMS quantification over ZT, two-way ANOVA followed by Sidak’s multiple comparisons test, the main effect of genotype, F (1,264) = 10.26, **P = 0.002. (D) NREMS total time quantification, *P = 0.024; light, P = 0.411; dark, **P = 0.008. (E) REMS quantification over ZT, two-way ANOVA followed by Sidak’s multiple comparisons test, the main effect of genotype, F (1,263) = 1.492, P = 0.223. (F) REMS total time quantification, P = 0.668; light, P = 1.000; dark, P = 0.055. n = 7 for Tfap2b+/+, n = 6 for Tfap2b+/−. Two-tailed unpaired t-tests were used for (B, D, and F). All data are shown as the mean ± SEM.

