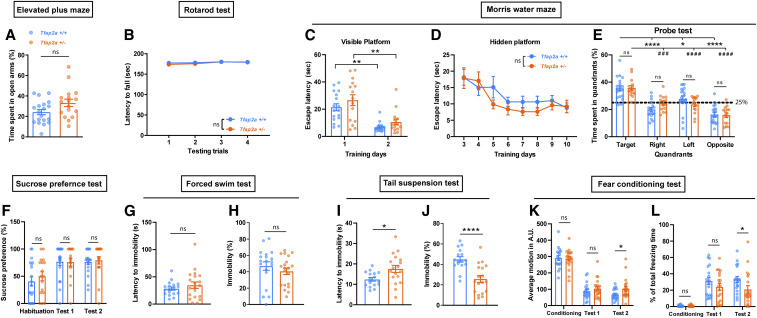
Figure 7.
Behavioral phenotyping of Tfap2a+/− mice reveals signs of mild hyperactivity. (A) Elevate plus maze, two-tailed unpaired t-test, P = 0.136. (B) Rotarod test, two-way ANOVA test, the main effect of genotype: F(1, 148) = 0.927, P = 0.337; the main effect of time, F(3, 148) = 2.512, P = 0.061. (C) Morris water maze (MWM), time spent searching for visible platform during two consecutive training days: to compare mutants and their controls, unpaired Student t-test was used for day 1, P = 0.274; Mann-Whitney U-test for day 2, P = 0.096. Wilcoxon two-sided signed-rank tests for two related samples were used for day 1 and day 2 within each genotype: Tfap2a+/+, **P = 0.001; Tfap2a+/−, **P = 0.004. (D) MWM, time spent searching for hidden platform during eight consecutive training days from day 3 to day 10. Two-way ANOVA tests followed by Sidak’s pairwise comparison, the main effect of genotype: F(1, 256) = 1.049, P = 0.307; the main effect of time, F(7, 256) = 8.652, P < 0.0001. (E) MWM, time spent in each quadrant during probe test: one-way ANOVA followed by Sidak’s pairwise comparison, F = 21.125, P < 0.0001. Tfap2a+/+ vs. Tfap2a+/−: target, P = 1.000; right, P = 0.819; left, P = 0.918; opposite, P = 1.000. Target vs. right/left/opposite quadrant in Tfap2a+/+: ****P < 0.0001, *P = 0.024, ****P < 0.0001. Target vs. right/left/opposite in Tfap2a+/−: ###P = 0.001, ####P < 0.0001, ####P < 0.0001. (F) Sucrose preference test: habituation, P = 0.379; test 1, P = 0.781; test 2, P = 0.415, Mann Whitney test. (G) Forced swim test (FST), latency to immobility, P = 0.830, Mann Whitney test. (H) FST, time spent immobile, P = 0.147, Mann Whitney test. (I) Tail suspension test (TST), latency to immobility, *P = 0.039, Mann Whitney test. (J) TST, time spent immobile, ****P < 0.0001, Mann Whitney test. (K) Fear conditioning test, average motion, training, P = 0.296; test 1, P = 0.428; test 2, *P = 0.028, Mann Whitney test. (L) Total freezing time, training, P = 0.771; test 1, P = 0.258; test 2, *P = 0.018, Mann Whitney test. Data are shown as the mean ± SEM n ≥ 16 for Tfap2a+/+, n ≥ 15 for Tfap2a+/−.

