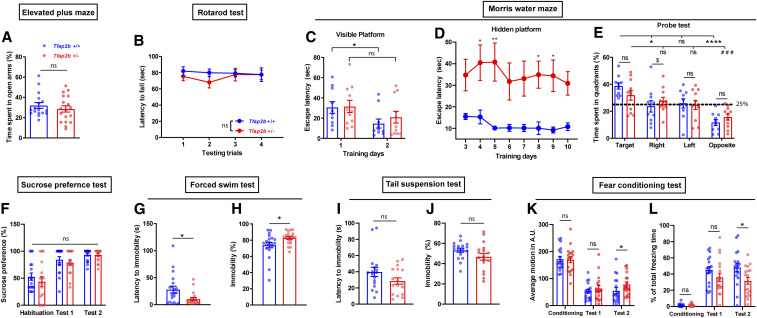
Figure 8.
Behavioral phenotyping of Tfap2b+/− mice reveals signs of mild depressive-like symptoms. (A) Elevated plus maze, P = 0.463, Mann Whitney test. (B) Rotarod test, two-way ANOVA test, the main effect of genotype: F(1, 136) = 1.313, P = 0.254; the main effect of time, F(3, 136) = 0.249, P = 0.862. (C) Morris water maze (MWM), time spent searching for visible platform during two consecutive training days: to compare mutants and their controls, unpaired Student t-test was used for day 1, P = 0.908; Mann-Whitney U-test for day 2, P = 0.557. Wilcoxon two-sided signed-rank tests for two related samples were used for day 1 and day 2 within each genotype: Tfap2b+/+, *P = 0.028; Tfap2b+/−, P = 0.091. (D) MWM, time spent searching for hidden platform during eight consecutive training days, Two-way ANOVA tests, the main effect of genotype: F(1, 148) = 63.40, P < 0.0001; the main effect of time, F(7, 148) = 0.377, P = 0.915; Sidak’s pairwise comparison between genotype,*P < 0.05,**P < 0.01. (E) MWM, time spent in each quadrant during probe test, one-way ANOVA followed by Sidak’s pairwise comparison, F = 7.381, P < 0.0001. Tfap2b+/+ vs. Tfap2b+/−: target, P = 1.000; right, $P = 0.034; left, P = 0.141; opposite, P = 1.000. Target vs. right/left/opposite quadrant in Tfap2b+/+: *P = 0.034, P = 0.141, ****P < 0.0001. Target vs. right/left/opposite in Tfap2b+/−: P = 1.000, P = 0.950, ###P = 0.009. (F) Sucrose preference test, habituation, P = 0.465; test 1, P = 0.372; test 2, P = 0.961, Mann Whitney test. (G) Forced swim test (FST), latency to immobility, *P = 0.039, Mann-Whitney test. (H) FST, time spent immobile, *P = 0.020, Mann-Whitney test. (I) Tail suspension test, latency to immobility, P = 0.231, Mann-Whitney test. (J) Tail suspension test, time spent immobile, P = 0.087, Mann-Whitney test. (K) Fear conditioning test, average motion, training, P = 0.815; test 1, P = 0.673; test 2, *P = 0.047, Mann Whitney test. (L) Fear conditioning test, total freezing time, training, P = 0.696; test 1, P = 0.152; test 2, *P = 0.027. Mann Whitney test. All data are shown as the mean ± SEM n ≥ 10 for Tfap2b+/+, n ≥ 11 for Tfap2b+/−.

