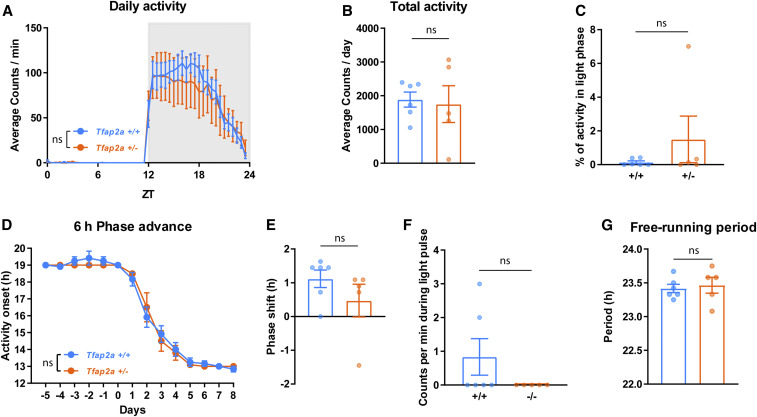
Figure 9.
Circadian rhythms are comparable to wild-type controls in Tfap2a+/− mice. (A) Daily activity, two-way ANOVA tests followed by Sidak’s pairwise comparison, the main effect of genotype: F(1, 432) = 1.133, P = 0.288; the main effect of time, F(47, 432) = 21.64, P < 0.0001. (B) Total activity, P = 0.931, Mann-Whitney test. (C) Activity in light phase, P = 0.784, Mann-Whitney test. (D) Six hours phase advance, Two-way ANOVA tests followed by Sidak’s pairwise comparison, the main effect of genotype: F(1, 126) = 0.169, P = 0.682; the main effect of time, F(13, 126) = 156.8, P < 0.0001. (E) Phase shift, P = 0.197, Mann-Whitney test. (F) Locomotor activity during light pulse, P = 0.455, Mann-Whitney test. (G) Free-running period during constant darkness, P = 0.626, Mann-Whitney test. All data are shown as the mean ± SEM n = 6 for Tfap2a+/+, n = 5 for Tfap2a+/−.

