Figure 2.
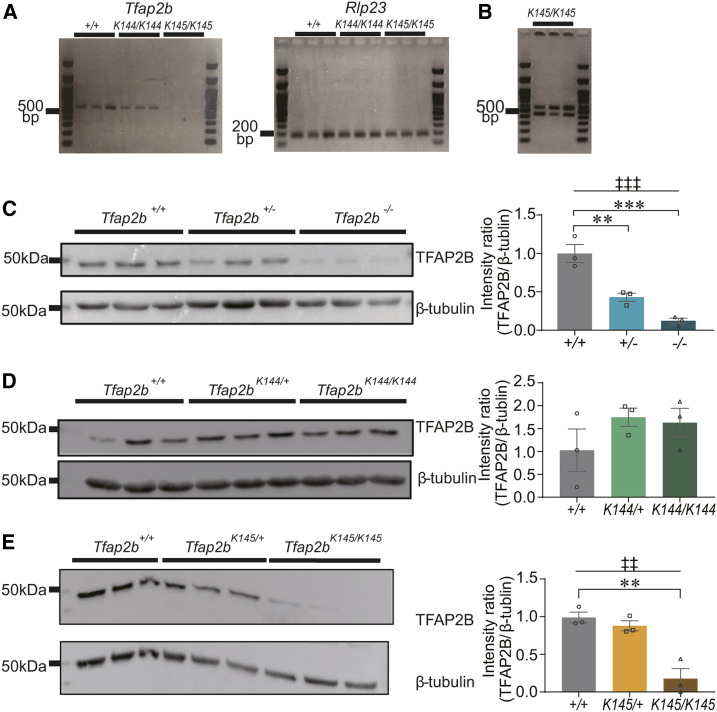
RT-PCR and Western blot analyses of Tfap2b mutant mice. (A) Results of RT-PCR using total RNA from whole brain samples of Tfap2b+/+, Tfap2bK144/K144, and Tfap2bK145/K145 mice at E18.5. For RT-PCR of Tfap2b mRNA, primers that flank exons 3–5 were used. (B) Increasing amplification cycles of Tfap2b RT-PCR inTfap2bK145/K145 mice resulted in two products of different size. Each lane represents an individual mouse. N = 3 mice. (C–E) Results of Western blot using an anti-TFAP2B antibody applied to whole brain samples from mice at E18.5 harboring Tfap2b– (C), Tfap2bK144 (D), or Tfap2bK145 (E). Each lane represents an individual mouse. N = 3 mice. † indicates significance in one-way ANOVA (‡‡P < 0.01, ‡‡‡P < 0.001). * indicates significance in post hoc Dunnet’s test (**P < 0.01, ***P < 0.001). Data are mean ± SEM.

