Figure 3.
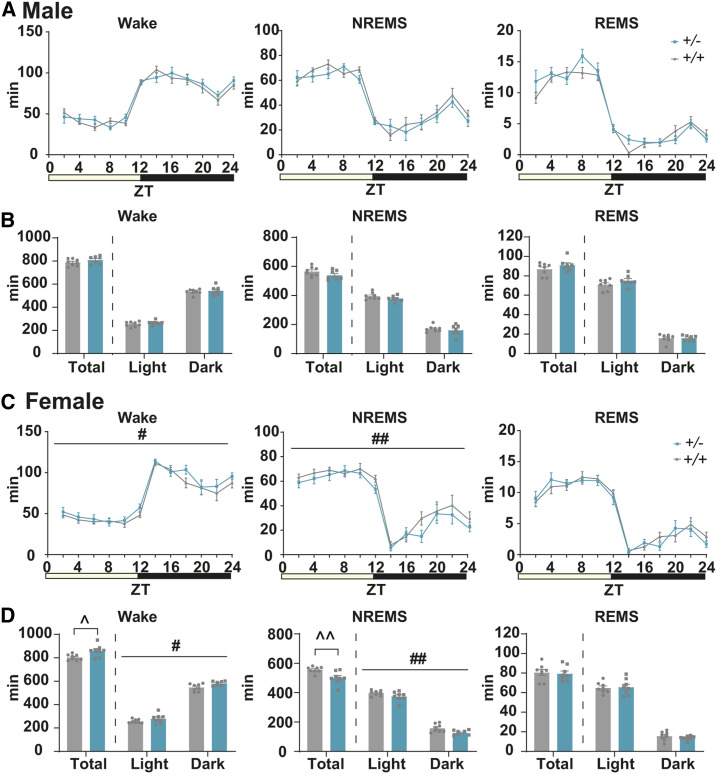
Comparison of the amount of sleep/wake in adult Tfap2b+/+ and Tfap2b+/− mice. (A) Bihourly amount of wakefulness, NREMS, and REMS across 24 hr in male mice. (B) Total amount of wakefulness, NREMS, and REMS during 24 hr, light phase, and dark phase in male mice. N = 8 Tfap2b+/+ mice, N = 7 Tfap2b+/− mice. (C) Bihourly amount of wakefulness, NREMS, and REMS across 24 hr in female mice. (D) Total amount of wakefulness, NREMS, and REMS during 24 hr, light phase, and dark phase in female mice. N = 8 Tfap2b+/+ mice, N = 8 Tfap2b+/− mice. # indicates significant main effect of genotype in two-way repeated-measures ANOVA (#P < 0.05, ##P < 0.01). ^ indicates significance in the Welch’s test (^P < 0.05, ^^P < 0.01). Data are mean ± SEM.

