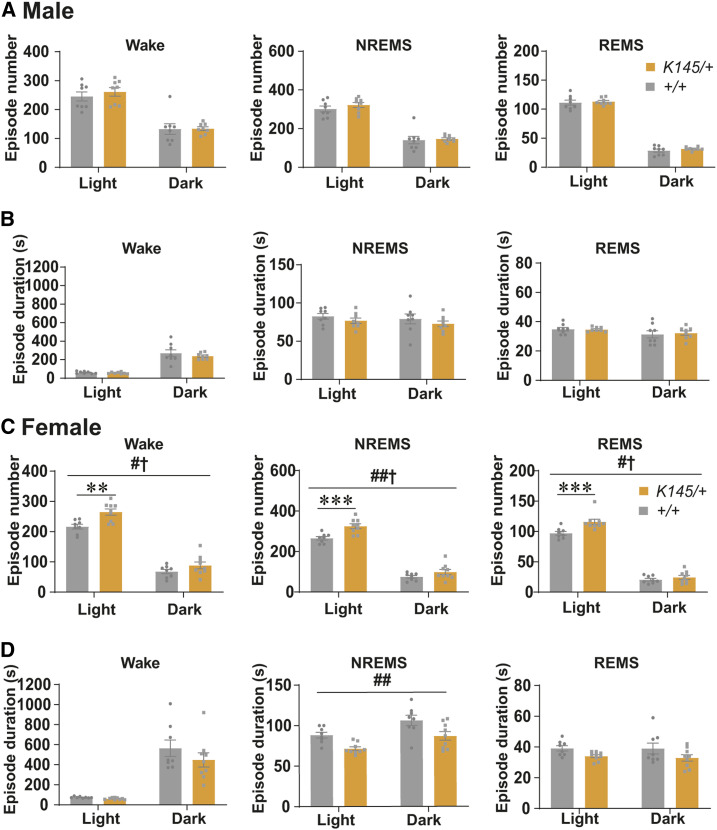
Figure 6.
Comparison of the sleep episode number and duration in adult Tfap2b+/+ and Tfap2bK145/+ mice. (A, B) Episode numbers (A) and durations (B) of wakefulness, NREMS, and REMS during 24 hr, light phase, and dark phase in male mice. N = 8 Tfap2b+/+ mice, N = 8 Tfap2bK145/+ mice. (C and D) Episode numbers (C) and durations (D) of wakefulness, NREMS, and REMS during 24 hr, light phase, and dark phase in female mice. N = 8 Tfap2b+/+ mice, N = 9 Tfap2bK145/+ mice. # and † indicate significant main effect of genotype and significant interaction between genotype and light/dark phase, respectively, in two-way repeated-measures ANOVA (#,†P < 0.05, ##P < 0.01). * indicates significance in post hoc Bonferroni multiple comparison test (**P < 0.01, ***P < 0.001). Data are mean ± SEM.

