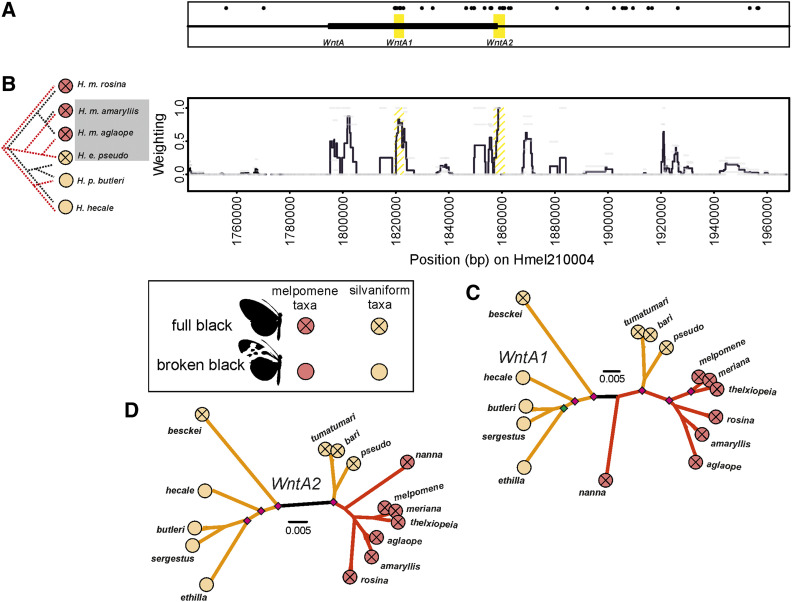
Figure 5.
Paired phylogenetic Twisst comparison across the WntA region of scaffold Hmel210004. (A) Shows location of WntA, and putative functional elements. Black bar shows the WntA gene, yellow shading shows putative regulatory elements. Diagnostic fixed SNPS between phenotypes shown with black dots in (A). (B) Twisst comparison (100 SNP windows sliding by 25 SNPs) with Peruvian hybrid zone taxa. Mimetic phenotypes for taxa are shown by circles; red circles for H. melpomene clade and orange circles for silvaniform taxa. (C and D) Maximum likelihood phylogenies of putative elements; see Figure 2 legend for more detailed explanations. Note positions of black branches on phylogenies which have been drawn on the longest branches from where H. besckei connects to phylogeny.

