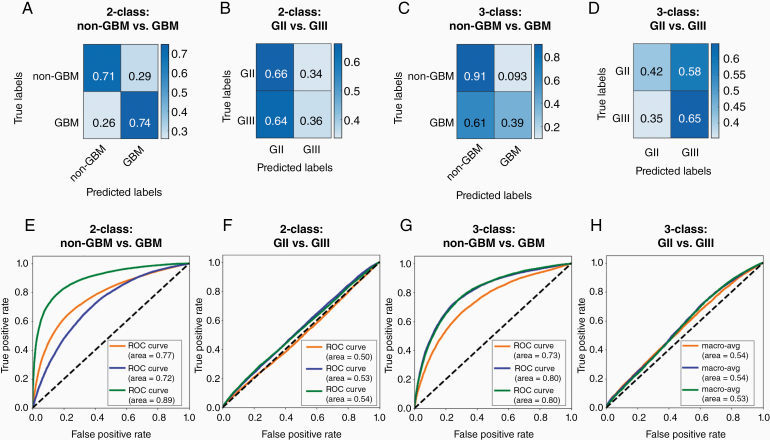
Figure 4.
Confusion matrices and receiver operating characteristic (ROC) curves for 2-class and 3-class classifying models distinguishing different classes. Confusion matrices for 2-class models (A) distinguishing between non-glioblastoma (GBM), which includes grades II and III, and GBM and (B) distinguishing between grades II and III. Three-class models were trained to distinguish between all 3 grades. Confusion matrices for 3-class models for classification (C) between grades II and III combined (non-GBM) and GBM and (D) between grades II and III. Values are a fraction of the total count for the respective true label (ie, each value is a proportion of the total of its row). Confusion matrices are used to calculate accuracies. ROC curves are plotted for 2-class classifying models (E) distinguishing between non-GBM and GBM and (F) distinguishing between grades II and III. Within 3-class models, ROC curves are plotted for classification (G) between grades II and III combined and GBM and (H) between grades II and III. Each type of model (ie, two 2-class models and a single 3-class model) was trained 3 separate times, with the same training datasets, augmentation strategy, and hyperparameters. Each ROC curve summarizes a model trained and the area under each ROC curve is calculated.

