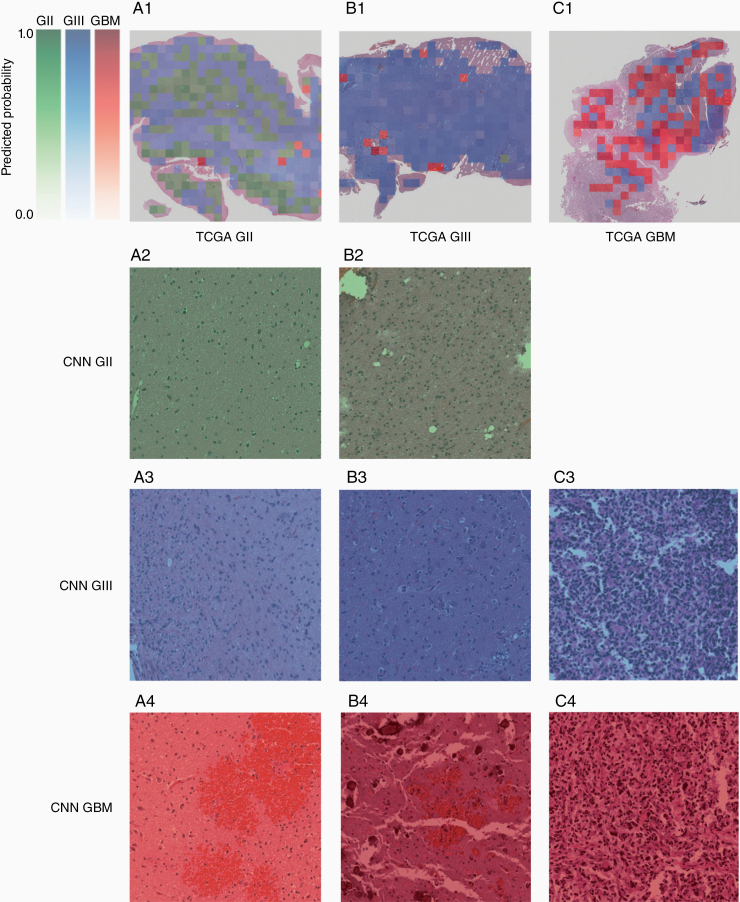
Figure 5.
Examples of model output visualization. Whole-slide images (WSIs) are divided into tiles of size 1024 × 1024 at 20× magnification, and tiles with more than 90% tissue are used as inputs for the model. A single voxel is ≈0.501 μm, and an individual tile is ≈513 × 513 μm. Outputs are obtained from the model on a tile basis in terms of scores for each class. The class with the highest score for each tile is chosen for visualization. Each class corresponds with a monochromatic color map, with green corresponding to grade II, blue to grade II, and red to GBM. The intensity of the color is logarithmically proportional to the output score so that higher scores are considerably more intensely visualized relative to lower scores. The scores reflect the model’s confidence in a particular prediction. Examples of (A1) a grade II WSI, (B1) a grade III WSI, and (C1) a GBM WSI with visualized model outputs. For example, individual tiles labeled by CNN as grade II (A2, B2), grade III (A3, B3, C3), and grade IV (A4, B4, C4) are shown for each of the patients (A–C). Considering the grade II patient (column A): a large number of tiles were detected as grade II by the CNN (continued on page 9) Figure 5. (continued from page 8) and indicated regions which showed normal or only a few neoplastic cells (A2); some tiles indicated the possibility of grade III regions which appeared to show higher cellularity (A3), although the confidence of the CNN was in this case low (pale blue); other tiles indicated the possibility of a GBM albeit again in a pale red indicating low confidence and showed regions of hemorrhage (A4). Considering the grade III patient (column B):3 tiles were indicated as grade II and while these regions showed insufficient pathology and cellularity for a grade III diagnosis, it is unclear why tile B2 is labeled as grade II while tile B3 is labeled as grade III. This highlights the importance of, in parallel, developing methods that indicate the regions of the tile that were considered most important by the CNN in making a diagnosis as discussed in Section Visualization of Output and Tumor Heterogeneity. Furthermore, within patient B, regions detected as GBM showed regions of hemorrhage (B4) similar to A4. Considering the GBM patient, no tiles were detected as grade II; regions detected as grade III were less vascular and slightly less polymorphic (C3) as compared to regions detected as GBM (C4).

