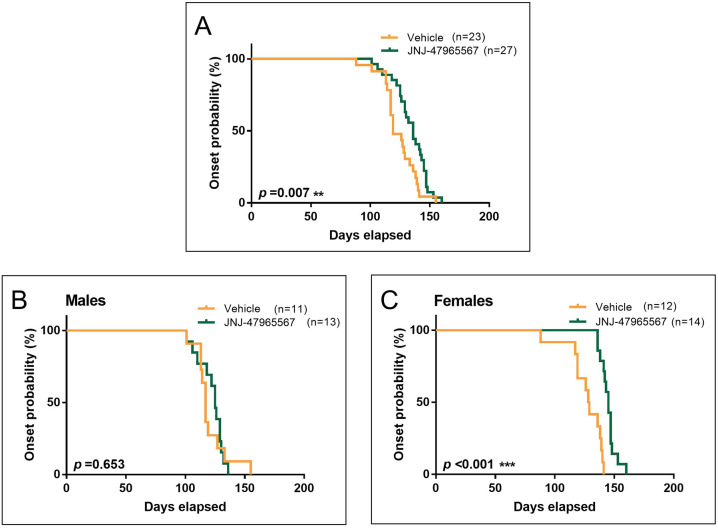
Fig. 3.
Disease onset of SOD1G93A ALS mice administered i.p. 4 times per week with vehicle (orange) or 30 mg/kg JNJ-47965567 (green). Disease onset was defined as the time mice were losing weight for 3 consecutive days. (A) Kaplan–Meier plot showing disease onset probability in the whole group of mice. (B) Kaplan–Meier plot showing onset probability in the subset of male mice. (C) Kaplan–Meier plot showing onset probability in the subset of female mice. Data analysis was performed using Cox regression, introducing age at first injection as co-variables. Differences were considered as statistically significant at P<0.05.

