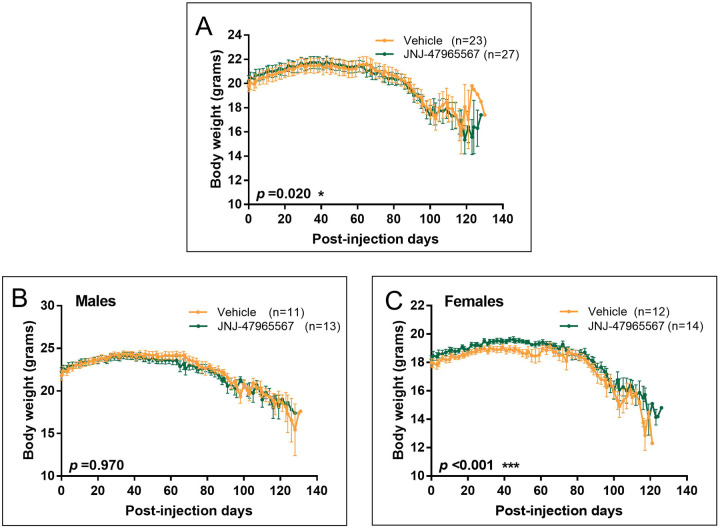
Fig. 4.
Variation in body weight of SOD1G93A mice during the treatment. Vehicle-treated mice are shown in orange; JNJ-47965567-treated mice are represented in green. (A) Body weight variation in the whole group of mice. (B) Body weight variation in the subset of male mice. (C) Body weight variation in the subset of female mice. Data are presented as mean±s.e.m. Data analysis was performed with unpaired t-test or Mann–Whitney test, depending on the normality of the data, and differences were considered statistically significant at P<0.05.

