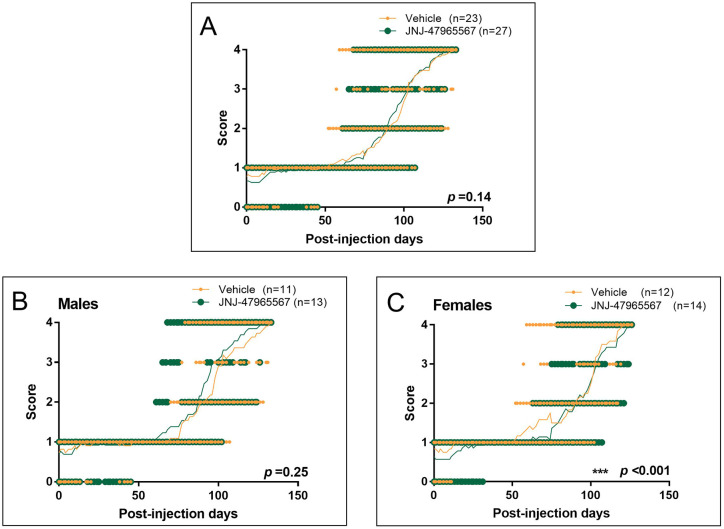
Fig. 6.
Disease progression evaluated according to the NeuroScore test, ranging from 0 (i.e. presymptomatic) to 4 (i.e. endpoint). Graphs show individual scores over the duration of the disease; the mean is represented by a thin line. Mice administered with vehicle are shown in orange; JNJ-47965567-treated mice are represented in green. (A) NeuroScore variation in the whole group of mice. (B) NeuroScore variation in the subset of male mice. (C) NeuroScore variation in the subset of female mice. Data analysis was performed with unpaired t-test or Mann–Whitney test, depending on data normality, and differences were considered statistically significant at P<0.05.

