Fig. 2.
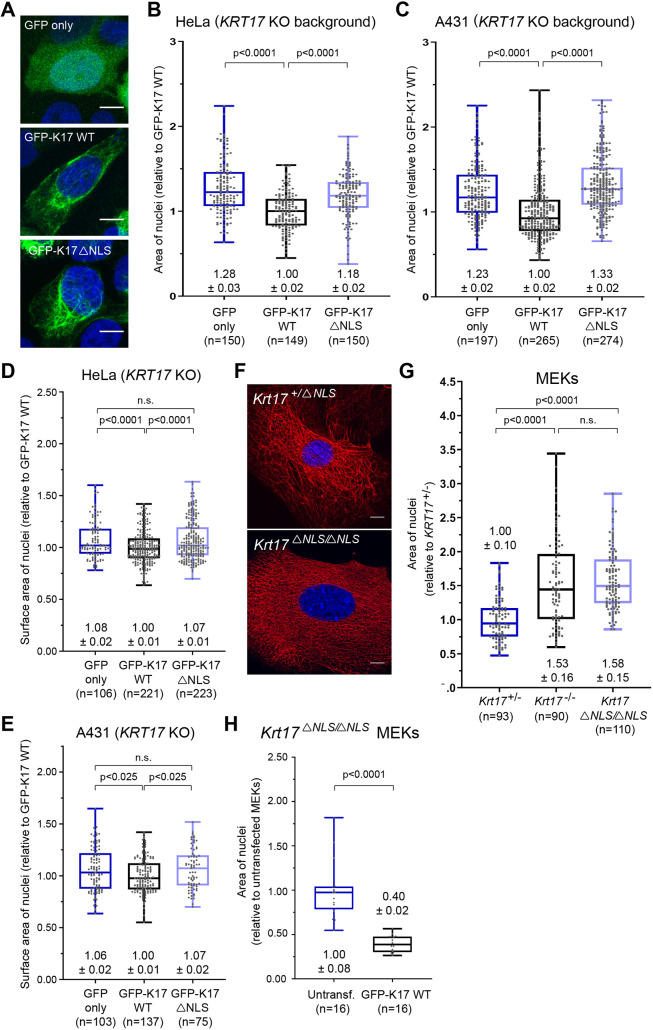
Impact of K17 on nuclear morphology requires an intact NLS. (A) Confocal micrograph MIPs of HeLa KRT17 KO cells transiently transfected (48 h) with GFP, GFP–K17 WT or GFP–K17ΔNLS (green). Nuclei are stained with DAPI (blue). Scale bars: 10 μm. (B,C) Quantified area (2-dimensional; 2D) of nuclei from (B) HeLa KRT17 KO and (C) A431 KRT17 KO cells expressing GFP, GFP–K17 WT or GFP–K17ΔNLS. (D,E) Quantified surface area (3-dimensional; 3D) of nuclei from (D) HeLa KRT17 KO and (E) A431 KRT17 KO cells expressing GFP, GFP–K17 WT or GFP–K17ΔNLS. (F) Confocal MIPs for K17 (red) in MEKs from Krt17+/ΔNLS and Krt17ΔNLS/ΔNLS mice. Nuclei are stained with DAPI (blue). Scale bars: 10 μm. (G) Quantified area of nuclei from primary MEKs from Krt17+/−, Krt17−/− and Krt17ΔNLS/ΔNLS mice. (H) Quantified area of nuclei from Krt17ΔNLS/ΔNLS MEKs untransfected or transfected with GFP-K17 WT. For B–E, G, H, numbers above or below each box-and-whisker plot represent the mean±s.e.m. In the box-and-whisker plots, the box represents the 25–75th percentiles, and the median is indicated. The whiskers show the minimum and maximum values. P-values shown were calculated with a Student's t-test with two-tailed distribution, and two-sample equal variance (homoscedastic). n.s., not significant.

