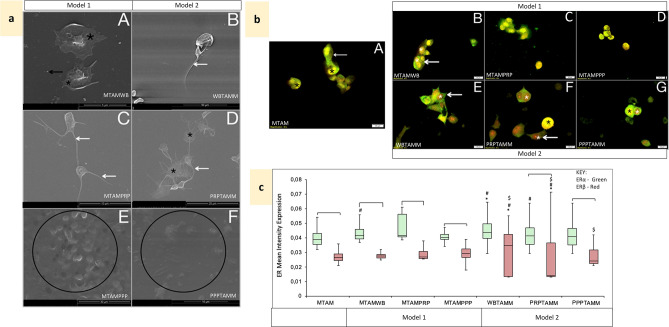
Figure 5.
Effects of Tamoxifen treatment, cumulative (Model 1) and circulatory (Model 2) following co-incubation with MCF7 cells. MTAM Tamoxifen-treated MCF7 cells. MTAMWB Tamoxifen-treated MCF7 cells co-incubated with WB. MTAMPRP Tamoxifen-treated MCF7 cells co-incubated with PRP. MTAMPPP Tamoxifen-treated MCF7 cells co-incubated with PPP. WBTAMM Tamoxifen-treated WB co-incubated with MCF7 cells. PRPTAMM Tamoxifen-treated PRP co-incubated with MCF7 cells. PPPTAMM Tamoxifen-treated PPP co-incubated with MCF7 cells. (a) Platelet ultrastructural alterations. Black *—platelet hyalomere spread, white arrow—extending filipodia, black arrow—microparticles, black circle—fibrin clots and plaques with pores. A: MTAMWB—active platelets with a hyalomere spread and microparticles. B: WBMTAM—active platelets with a folded membrane and extending filipodia. C: MTAMPRP—platelets with a hyalomere spread and extending filipodia. D: PRPTAMM—platelets in early stages of aggregation, with extending filipodia. E: MTAMPPP—fibrin plaque formation with some pores. F: PPPTAMM—fibrin pores and remnants of fibrin. (b) Co-localisation of ERα (green) and ERβ (red) in MCF7 cells; following Tamoxifen-treatment and exposure to blood constituents (Model 1) and Tamoxifen-treatment of blood constituents exposed to MCF7 cells (Model 2). A: MTAM—cytoplasmic and nuclear ERα (arrow) and nuclear ERβ (*). B: MTAMWB—nuclear and cytoplasmic ERα (arrow) and nuclear ERβ (*). C: MTAMPRP—nuclear and low cytoplasmic ERα (arrow) and nuclear ERβ (*). D: MTAMPPP—low cytoplasmic and high nuclear ERα (arrow) and nuclear ERβ (*). E: WBTAMM—high cytoplasmic ERα (arrow) and extremely high nuclear ERβ (*). F: PRPTAMM—low cytoplasmic ERα (arrow) and high nuclear ERβ (white *), combined expression is noted (black *). G: PPPTAMM—cytoplasmic ERα with nuclear of ERβ (*). (c) Box and whisker plots representing quantitative analysis of ERα (green) and ERβ (red) expression in MCF7 cells for Model 1 and 2. [p < 0.05 between ERα and ERβ within the treatment group. #p < 0.05 between matched ERs compared to untreated MCF7. *p < 0.05 between matched ERs compared to Tamoxifen-treated MCF7. $p < 0.05 between matched ERs and blood constituent groups compared between models.

