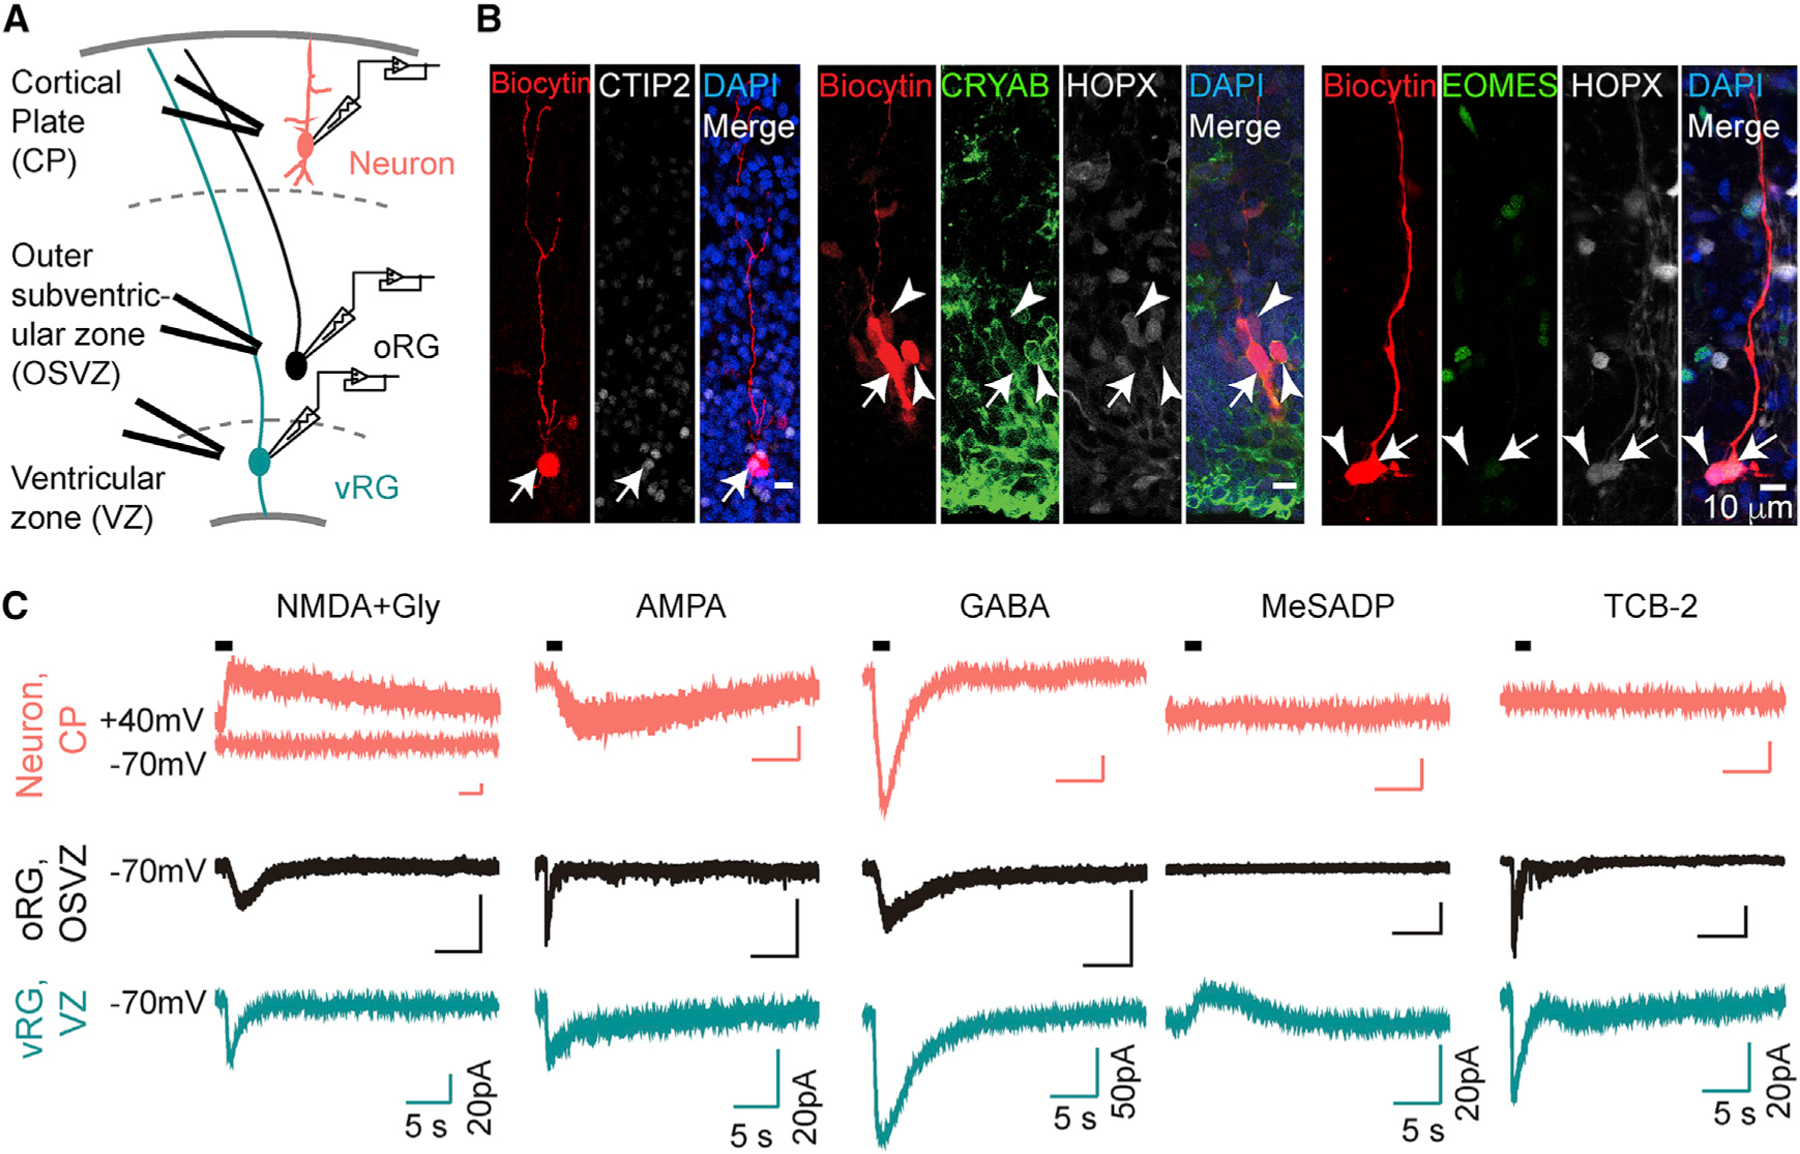
Figure 2. Patch-Clamp Recordings in Cortical Slices Show In Situ Receptor Functionality.

(A) Schematic diagram shows whole-cell patch clamp recordings with local application of agonists in slices.
(B) Cells were loaded with biocytin after recording and immunostained with cell-type-specific markers (arrows). Note that the vRG is coupled to both a vRG and an oRG cell (arrowheads, middle), while the oRG is coupled to another oRG cell (arrowheads, right).
(C) Example traces of currents in response to agonists. Neurons (red) were held at −60 mV except for NMDA + glycine (held at +40 mV). All oRGs (black) and vRGs (green) were recorded at a holding potential of −70 mV.
