
Figure 3. Ca2+ Imaging Reveals Lamina-Specific Responses to Neurotransmitter Receptor Agonists.
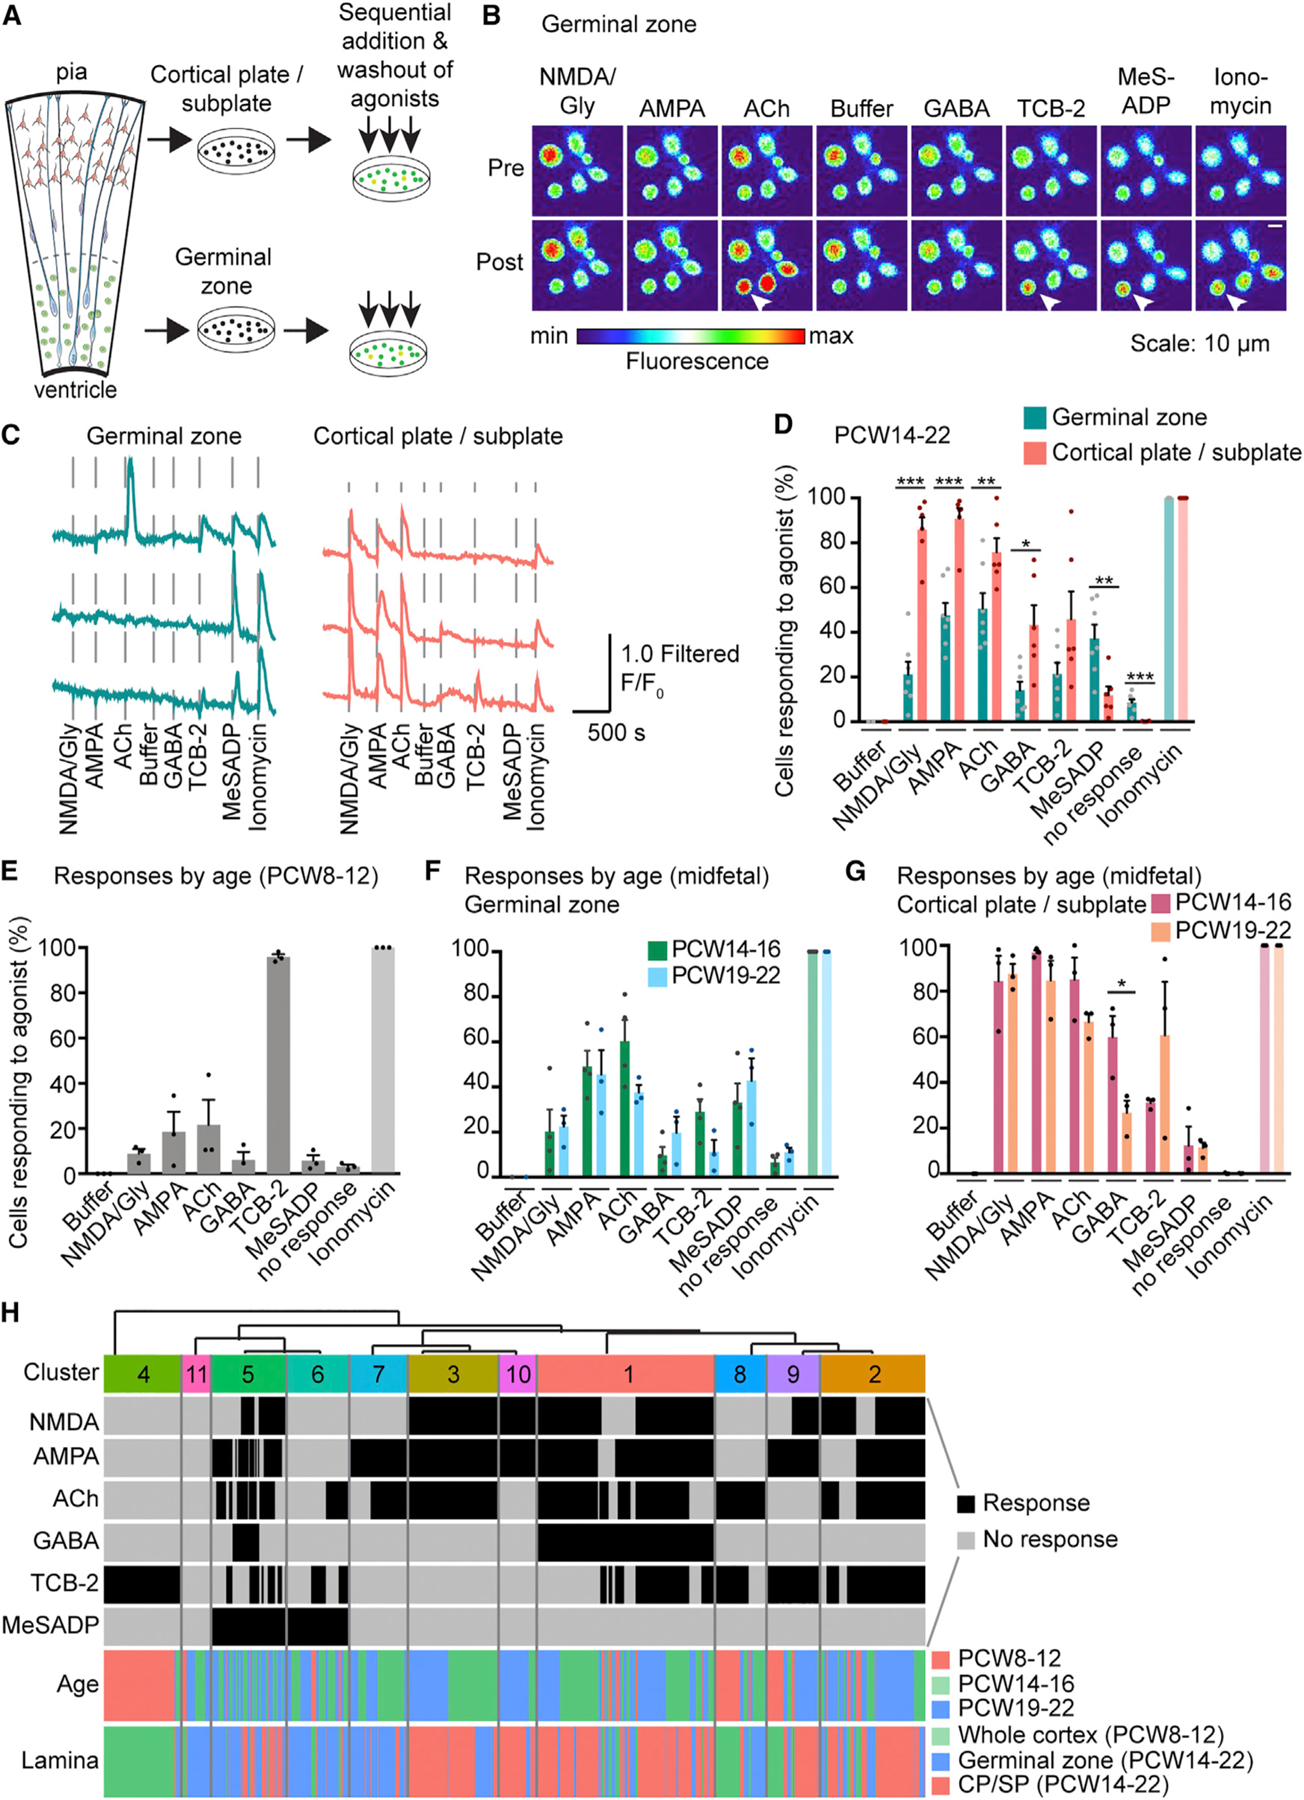
(A) Schematic of the experimental workflow for Ca2+ imaging of dissociated cells.
(B) Images of [Ca2+]i (pseudocolored) pre and post agonist application in cells dissociated from the GZ. Arrowheads indicate Ca2+ elevations of one representative cell in response to specific agonists.
(C) Traces of [Ca2+]i changes in response to agonist dosing.
(D) Summarized results of the percentage of cells showing Ca2+ elevation upon agonist stimulation in GZ and CP and SP, respectively (PCW14–22, binary quantification). N = 10, n = 2,613 cells.
(E–G) Summarized results of Ca2+ responses to the panel of neurotransmitter receptor agonists at PCW8–12 (N = 3, n = 608 cells) (E), and in the GZ (F) and in the CP and SP (G) by age range in midfetal development. No response indicates cells that only responded to ionomycin. A significant difference in GABA responses between PCW14–16 and PCW19–22 in CP and SP was found using multiple t tests (Holm-Sidak method). Data are represented as mean ± SEM. *p < 0.05, **p < 0.01, ***p < 0.001, dots indicate biological replicates.
(H) Single-cell Ca2+ responses to different agonists at different stages of development were co-clustered to reveal 11 distinct physiological clusters (n = 3,221 cells). GZ, germinal zone. SP, subplate.