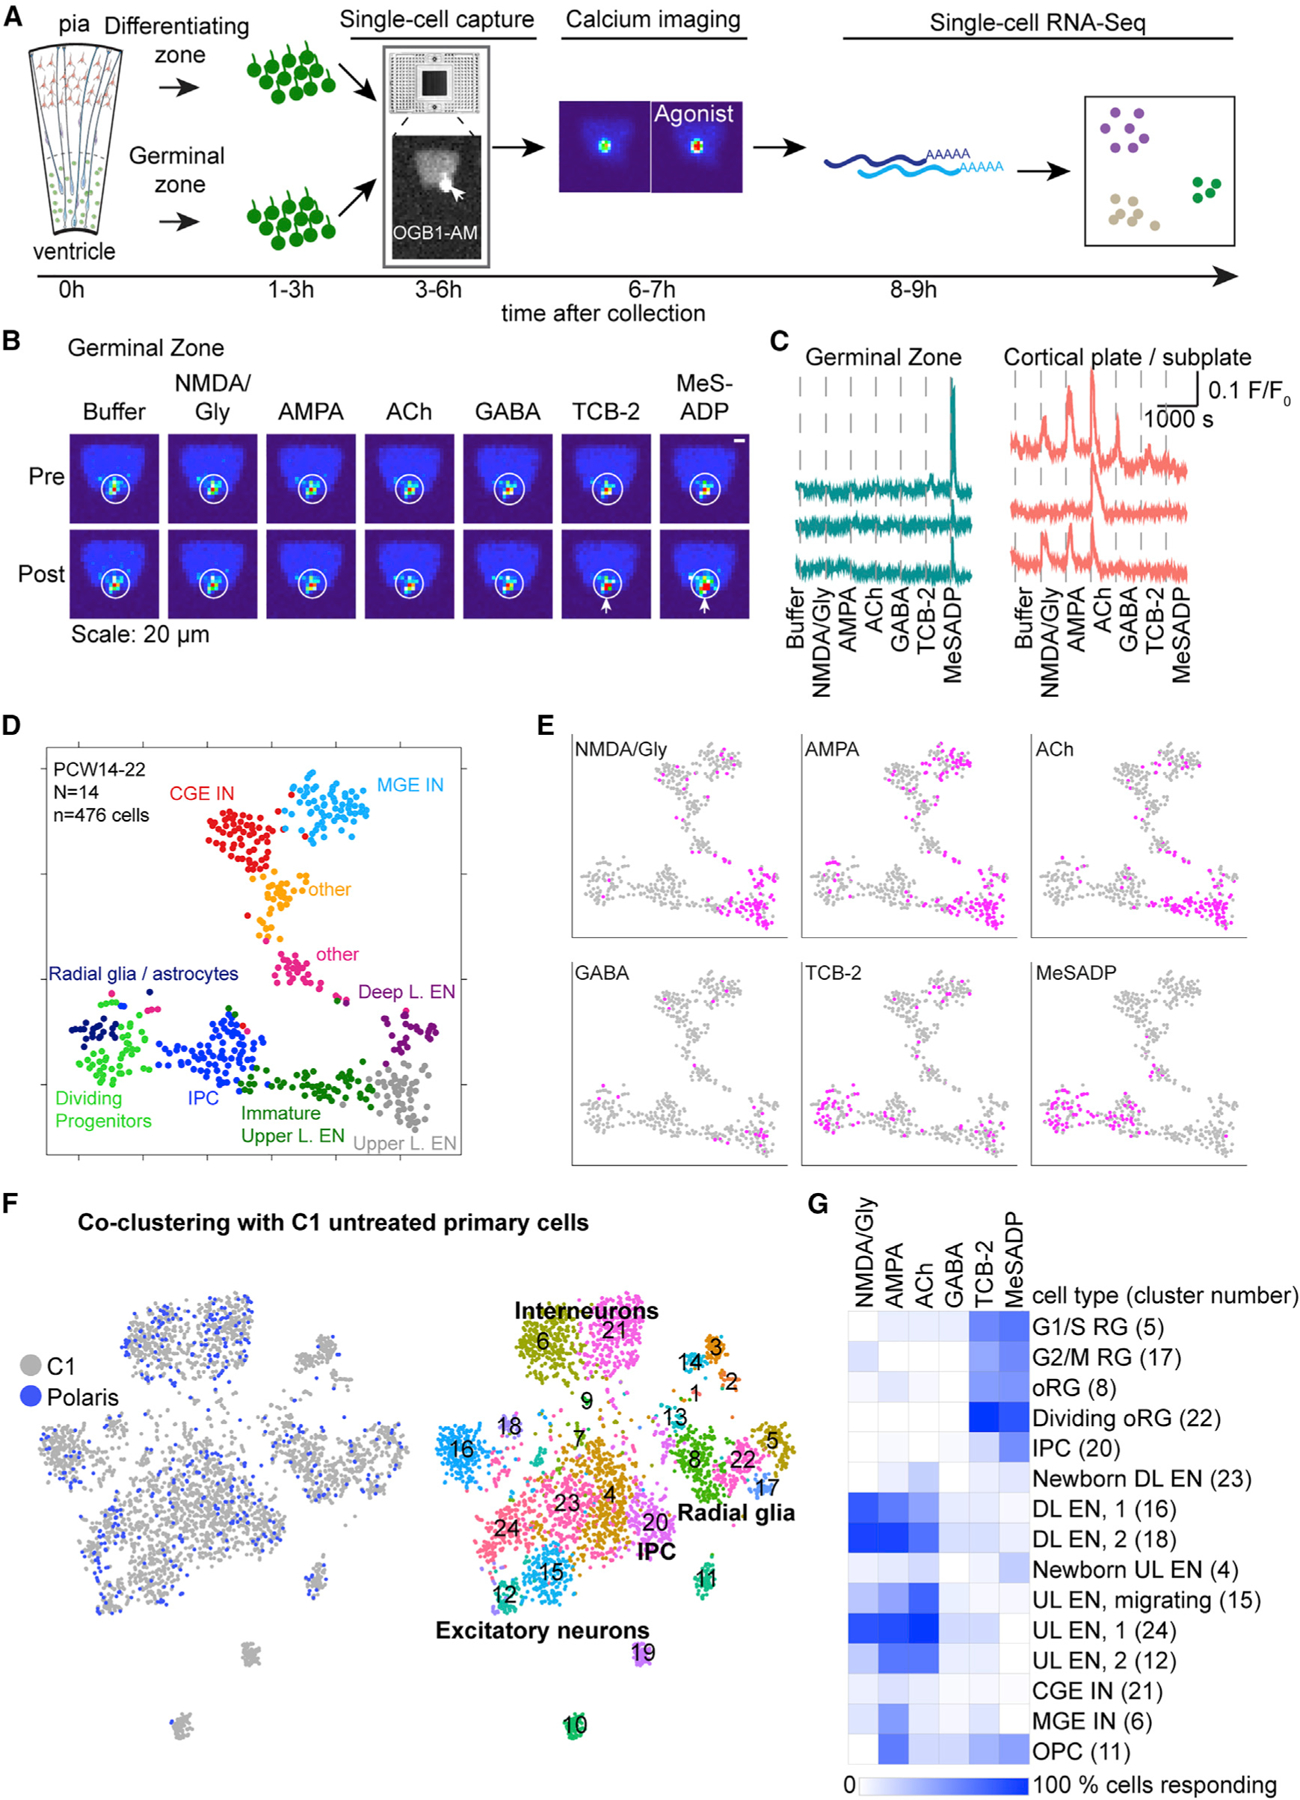
Figure 4. Mapping Ca2+ Responses onto Cell Types at the Single-Cell Level.

(A) Schematic of experimental workflow using the Polaris microfluidic system.
(B) Representative images of [Ca2+]i changes (pseudocolored) pre and post agonist application. Arrows indicate cell responding to agonist with Ca2+ elevation.
(C) Representative traces of Ca2+ changes in response to agonists.
(D) Unbiased clustering of cells into 10 molecular clusters based on their transcriptomes represented in t-distributed stochastic neighbor embedding (tSNE) space.
(E) Feature plots show responses to agonists (pink).
(F) Feature plots showing co-clustering of cells captured on Polaris or C1 microfluidic chips revealing 24 transcriptomic clusters.
(G) Heatmap shows the percentage of cells in each C1-Polaris transcriptomic cluster (row, cluster number indicated in brackets) responding to agonists (columns). Only clusters with more than 5 Polaris cells were included. RG, radial glia; L, layer; CGE, caudal ganglionic eminence; MGE, medial ganglionic eminence; UL, upper layer; DL, deep layer; OPC, oligodendrocyte progenitor cell; EN, excitatory neuron; IN, interneuron.
