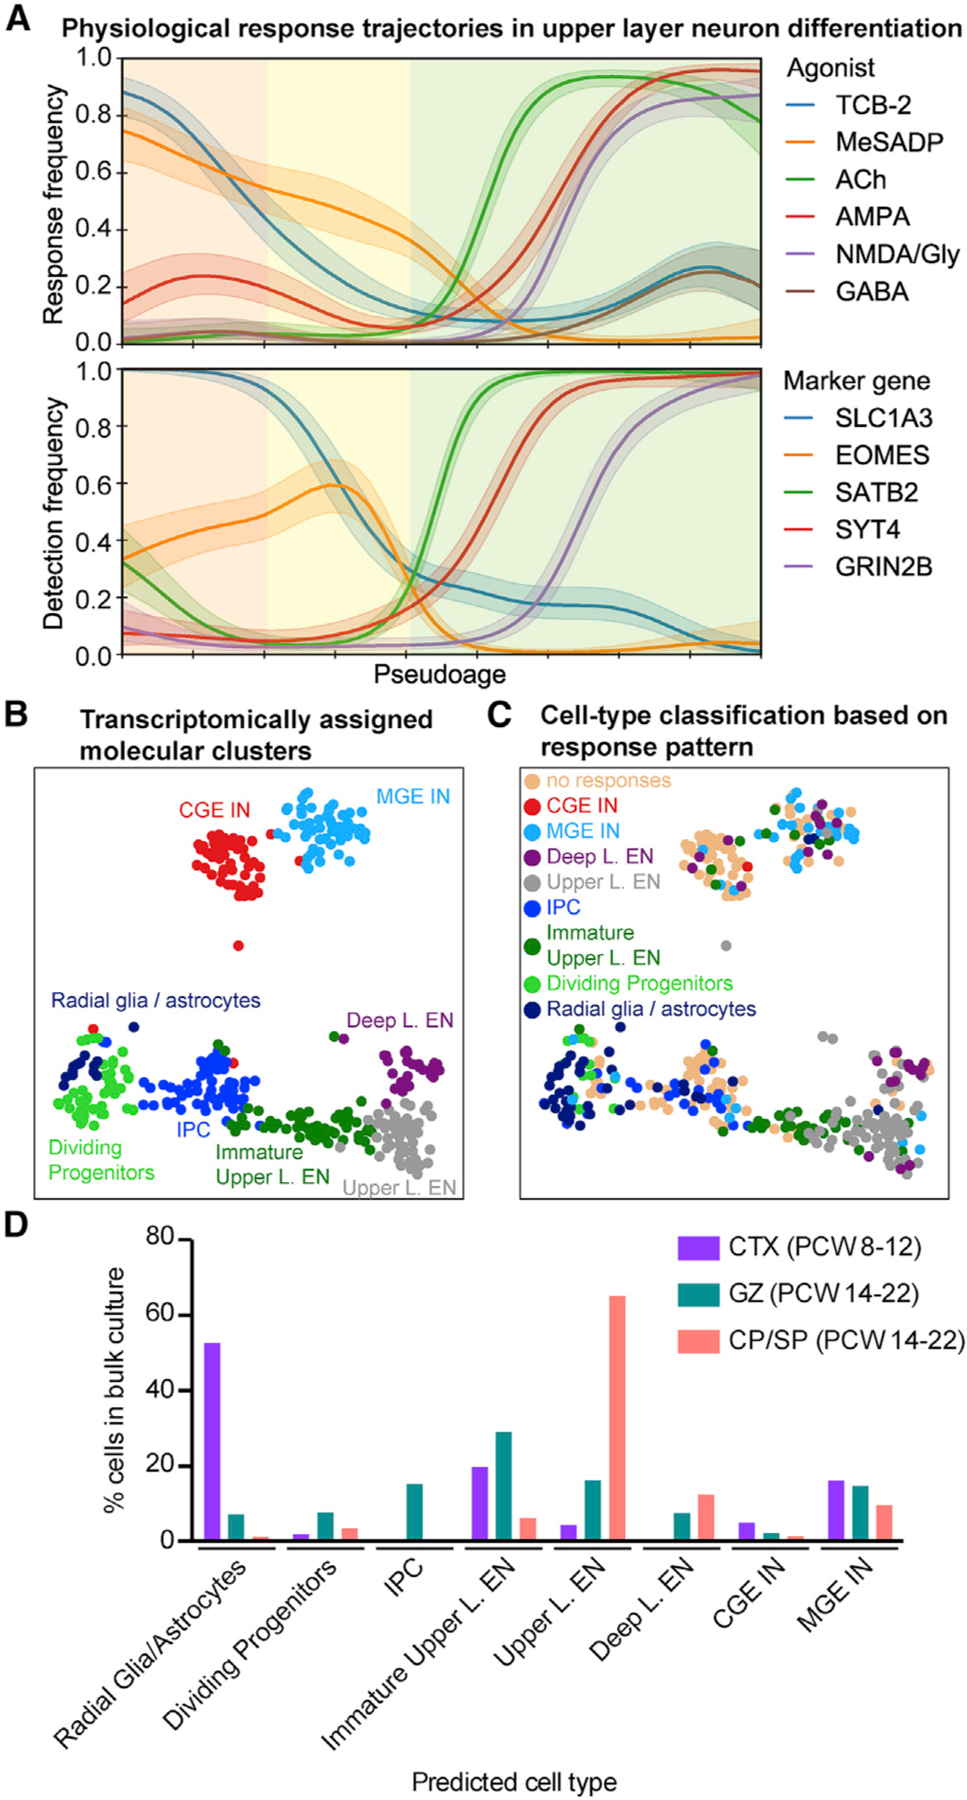
Figure 6. Physiological Response Patterns Predict Cell Identity.

(A) The frequency of responses to agonist application varies as a function of pseudoage (top). See detection frequencies of marker genes (bottom). Major cell types are highlighted by shading: radial glia cells, orange; intermediate progenitor cells, yellow; excitatory neurons, green.
(B) Transcriptomically defined cell types, excluding clusters “other,” which are outliers.
(C) Predicted cell-type assignments of a classifier trained on the physiological response patterns in a multimodal dataset, relative to their transcriptomically defined cell types (B).
(D) Predicted cell type based on responses to agonists of cells analyzed in bulk imaging experiments (Figures 3E and 3F). Percentage of cells relative to the total number of cells responding to at least one agonist is shown. CTX, neocortex.
