
Figure 7. Physiological Heterogeneity Exists within Transcriptomically Defined Cell Types.
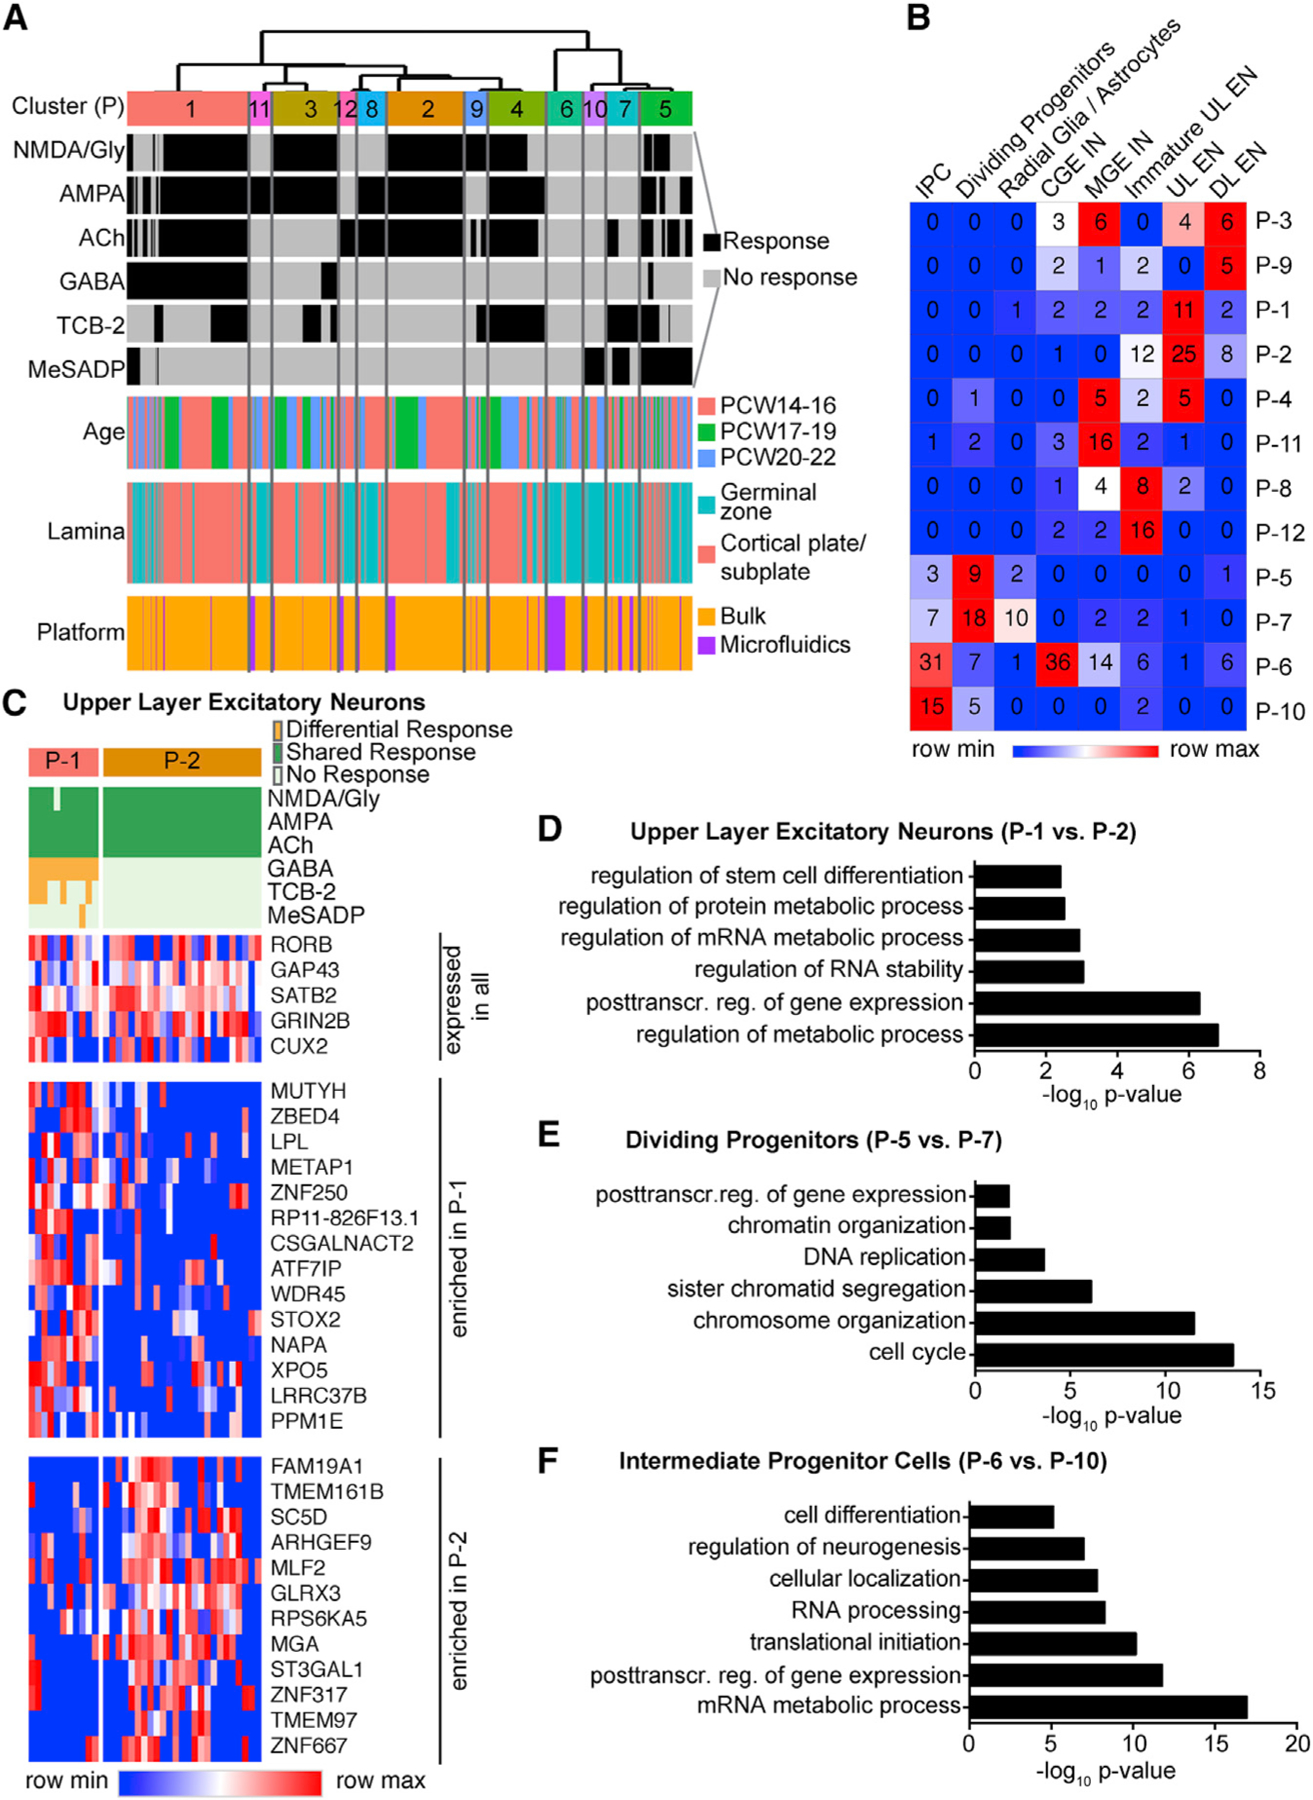
(A) Single-cell Ca2+ responses to different agonists analyzed on microfluidic chips and on physiological rig were co-clustered to reveal physiological types (P).
(B) Heatmap showing the relative responses to each neurotransmitter (columns) in the different physiological types (P, rows). Numbers in heatmap indicate number of cells in each cluster analyzed on microfluidic chips at the single-cell level.
(C) Heatmap highlighting representative genes that are expressed in all mature upper layer excitatory neurons or enriched in physiological cluster P-1 or P-2.
(D–F) Differential gene expression between distinct physiological types within one cell type. Top Gene Ontology terms enriched in differentially expressed genes between physiological types P-1 and P-2 in mature upper layer excitatory neurons (D), between physiological types P-5 and P-7 in dividing progenitors (E), and between physiological types P-6 and P-10 in intermediate progenitor cells (F).