Figure 1.

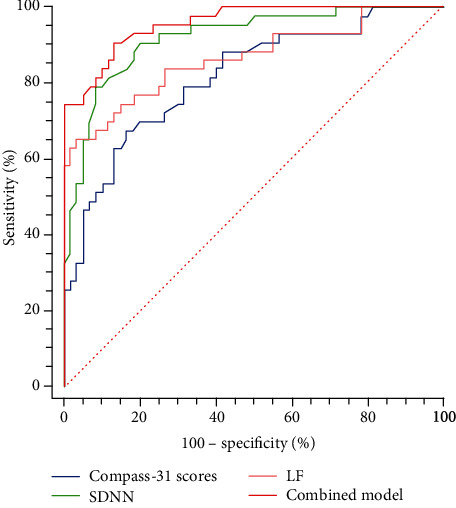
ROC curves comparing the ability of different variables and the combined model in distinguishing between participants with and without CAN. Combined model: the combination of COMPASS 31 score, SDNN, and LF.

ROC curves comparing the ability of different variables and the combined model in distinguishing between participants with and without CAN. Combined model: the combination of COMPASS 31 score, SDNN, and LF.