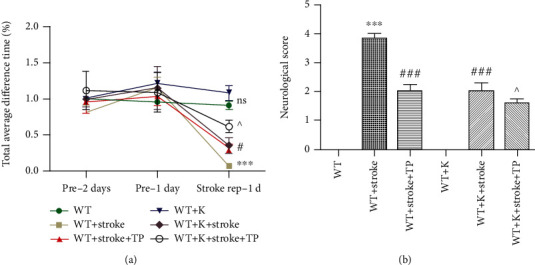
Figure 2.

TP and Ki20227 enhance behavioral function. (a) Graph represents the total time difference of experimental groups at pre-1 day, pre-2 days, and stroke rep-1 day. F values were, respectively, pre-1 day, pre-2 days. and stroke-rep 1 day. Data were expressed as mean ± SEM. No significant difference between the WT and WT+K groups; the WT group vs. WT+stroke group, ∗∗∗P < 0.001; the WT+stroke group vs. WT+stroke+TP group and WT+stroke+K group, #P < 0.05; the WT+stroke+K+TP group vs. WT+stroke+TP group and WT+stroke+K group, ^P < 0.05. Data were presented as mean ± SEM. Two-way ANOVA with Bonferroni's posttest, n = 11. (b) Quantitative analyses of neurological score of experimental groups at 1 day after stroke. Data were expressed as mean ± SEM. One-way ANOVA with Tukey's tests, n = 12. The WT vs. WT+stroke and WT+K vs. WT+stroke+K groups, ∗∗∗P < 0.0001; the WT+stroke vs. WT+stroke+TP and WT+stroke+K groups, ###P < 0.0001; and the WT+stroke+TP and WT+stroke+K vs. WT+stroke+K+TP, ^P < 0.05.
