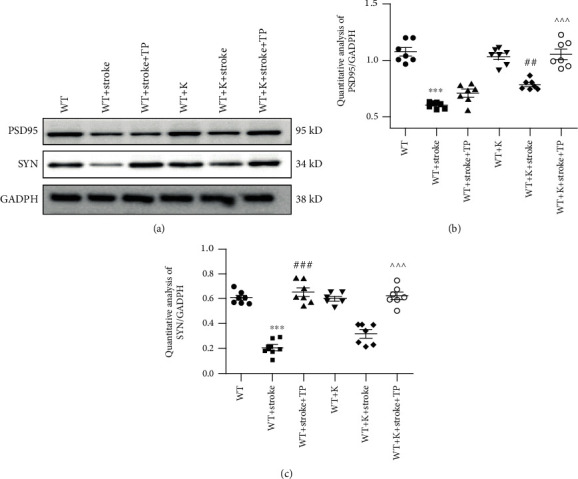
Figure 6.

TP and Ki20227 increase synaptic protein expressions. (a) Western blot images of SYN and PSD95 protein expressions of experimental groups. (b) Quantitative analyses of PSD95 protein expression and SYN protein expression. (c) Data were expressed as mean ± SEM. One-way ANOVA with Tukey's tests, n = 7. The WT vs. WT+stroke groups, ∗∗∗P < 0.001; the WT+K vs. WT+stroke+K groups, ∗∗P < 0.01; the WT+stroke+TP group vs. WT+stroke group, ###P < 0.001; and the WT+stroke+K+TP group vs. WT+stroke+TP and WT+stroke+K groups, ^^^P < 0.001.
