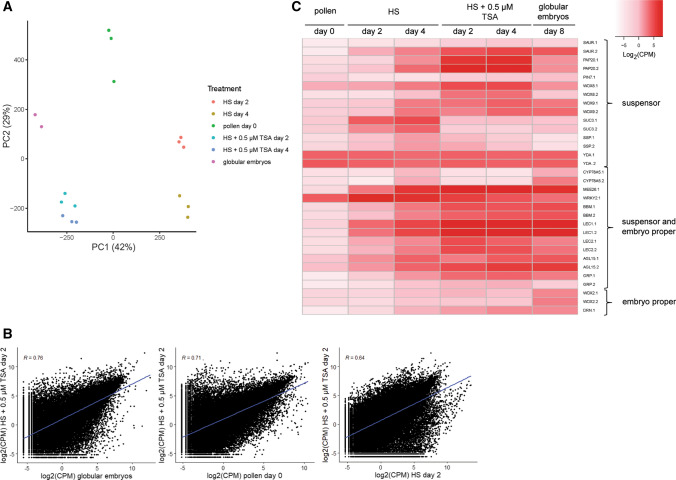
Fig. 6.
Expression profiles of B. napus embryo-expressed genes during pollen and haploid embryo development. a Principal component analysis (PCA) of the RNA-seq expression data for six different culture treatments. Biological replicates from the same treatment are represented by the same colour. b Scatterplots showing pairwise comparisons of gene expression data (log2CPM) from the indicated culture treatments. The Pearson correlation coefficients (R) and linear regression line are indicated. c Heatmap of RNA-Seq expression values (normalized log2(CPM)) for selected embryo-expressed genes in different cultures. The Brassica napus gene names and identifiers, as well as the relevant publications showing embryo or embryo region-enriched expression can be found in Supplemental Data File 1. Labels: d0, freshly isolated microspores/pollen; HS day 2, 2-day-old HS-treated cultures; HS day 4, 4-day-old HS-treated cultures; HS + 0.5 µM TSA day 2, 2-day-old HS + 0.5 µM TSA-treated cultures; HS + 0.5 µM TSA day 4, 4-day-old HS + 0.5 µM TSA-treated cultures; globular embryos, purified globular embryos from 8-day-old cultures treated with HS + 0.05 µM TSA

