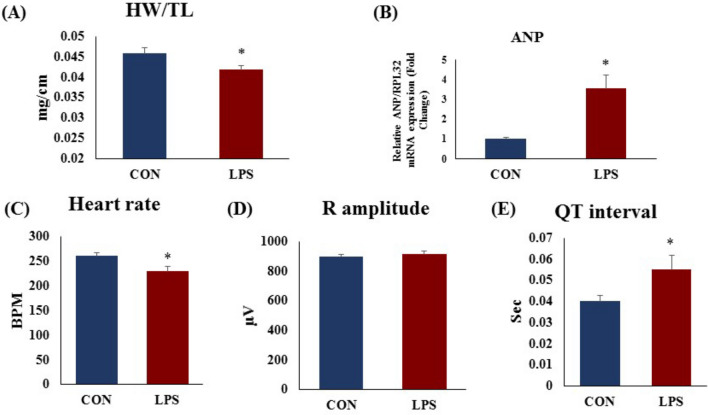
Figure 1.
Cardiac phenotypes, mRNA expression AND Electrocardiogram (ECG) perturbations in cardiac tissue and effect of TLR 4 activation. (A) Heart weight to tail length ratio (HW/TL) (B) mRNA expression of ANP (C) heart rate in beats per minute (BPM) (D) R amplitude (E) QT duration. The mRNA expression data was normalized to the expression of reference gene, ribosomal protein L32 (RPL32). Data shown as Mean ± SEM, (N = 6 for HW/TL, N = 4 for mRNA expression and ECG) *p < 0.05, **p < 0.01 vs CON.

