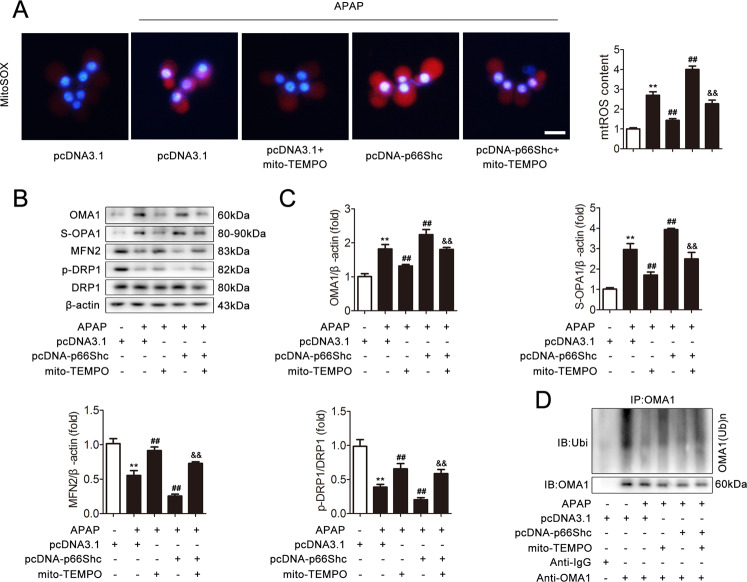
Fig. 3. p66Shc triggers APAP-induced mitochondrial dynamics perturbation through the regulation of mitochondrial ROS production.
AML12 cells were transected with pcDNA 3.1 or pcDNA-p66Shc and then incubated with mito-TEMPO under APAP treatment. a Mitochondrial ROS were determined via representative fluorescence images of MitoSOX-stained cells. Scale bar, 200 μm. b, c OMA1, S-OPA1, MFN2, DRP1, p-DRP1 protein, n = 3. d OMA1 ubiquitination level, n = 3. **p < 0.01 vs. the pcDNA 3.1 group; ##p < 0.01 vs. the APAP group; &&p < 0.01 vs. the pcDNA-p66Shc group.

