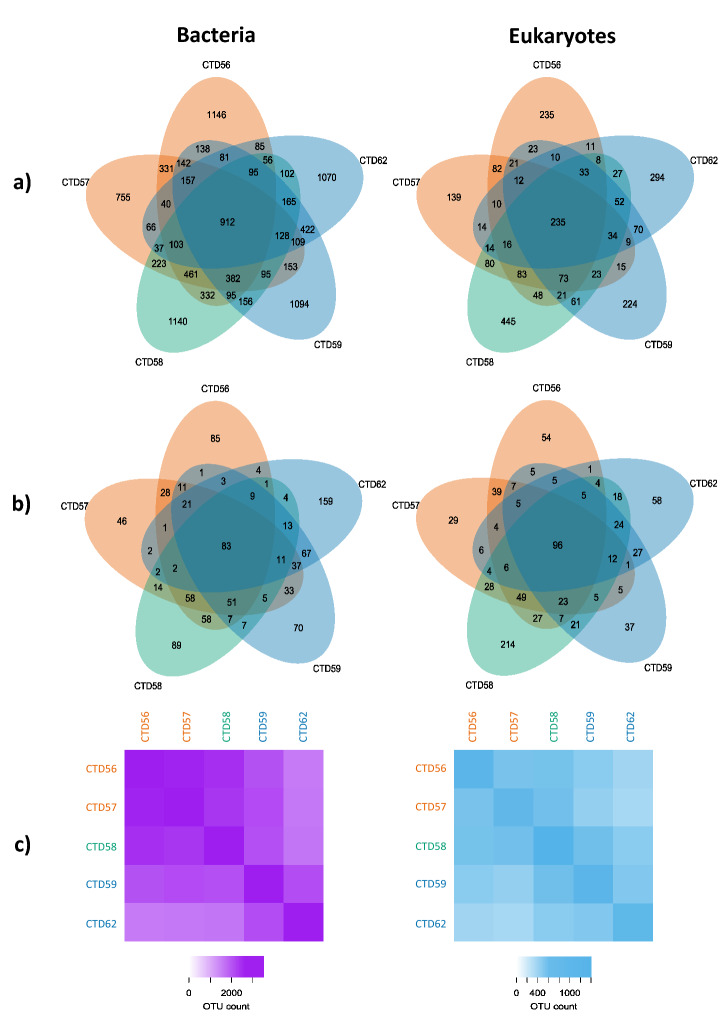
Figure 4.
Analysis of shared and unique bacterial and eukaryotic OTUs found within stations across the transect. Shown are the OTUs shared between stations, and those unique to stations for (a) the entire sampled community, as well as (b) with those OTUs represented by < 10 sequences at any one station excluded for both the bacterial (left) and eukaryotic communities (right). Numbers represent the count of unique OTUs. OTU counts in station ellipses which do not overlap with any other represent the number of unique OTUs specific to that station, whereas those that do overlap represent the number of OTUs found within those stations for which ellipses overlap. Also shown is (c) the number of unique OTUs shared between each pair of stations, with the number of OTUs represented by the colour scale, lighter shades indicate fewer OTUs. Stations are coloured according to the degree of Polar Water influence as in Fig. 1; orange-LI, green-MI, blue-HI.

